

Tools guide
Byul's website includes investing tools that bring news, charts and market indexes together. This guide explains what each tool shows and how to read and use it.
On every tool page, click the Guide button at the top right to open that tool's documentation.
Which tool should I use?
| If you want to know | Use this tool |
|---|---|
| What news is moving the market right now | Live News |
| Why a stock moved sharply on a specific day | News Timeline |
| What indicators like moving averages and RSI say about a chart | Technical Analysis |
| How far a stock is below its peak, and how long past recoveries took | Drawdown Analyzer |
| Which months have been strong or weak | Monthly Returns |
| Past periods that looked like today, and what came next | Past Similar Flow |
| Whether the market is in fear or greed | Market sentiment indexes |
| How SPY moved after Fear & Greed reached certain levels | Fear & Greed vs SPY |
| Compound growth or dollar-cost averaging results | Compound Calculator & DCA Simulator |
Before you start
- Login: Live News, the market sentiment indexes and the Compound Calculator work without logging in. The other tools require you to log in.
- Choosing a stock: In tools that analyze a stock, switch stocks with the symbol tabs at the top, or search for another one with the + button. Save stocks you check often to your watchlist so they stay in the tabs. The Drawdown Analyzer analyzes stocks on your watchlist.
- Language: You can use the site in Korean, English or Japanese, and your choice stays as you move between tools.
Use it with AI Research
On any tool page, click the AI Research button at the bottom right to ask questions based on the symbol, period and indicator values on your screen. Example questions for each tool are in the AI Research guide.
Byul's tools and AI Research are for information only and do not recommend buying or selling any security.
Guide contents
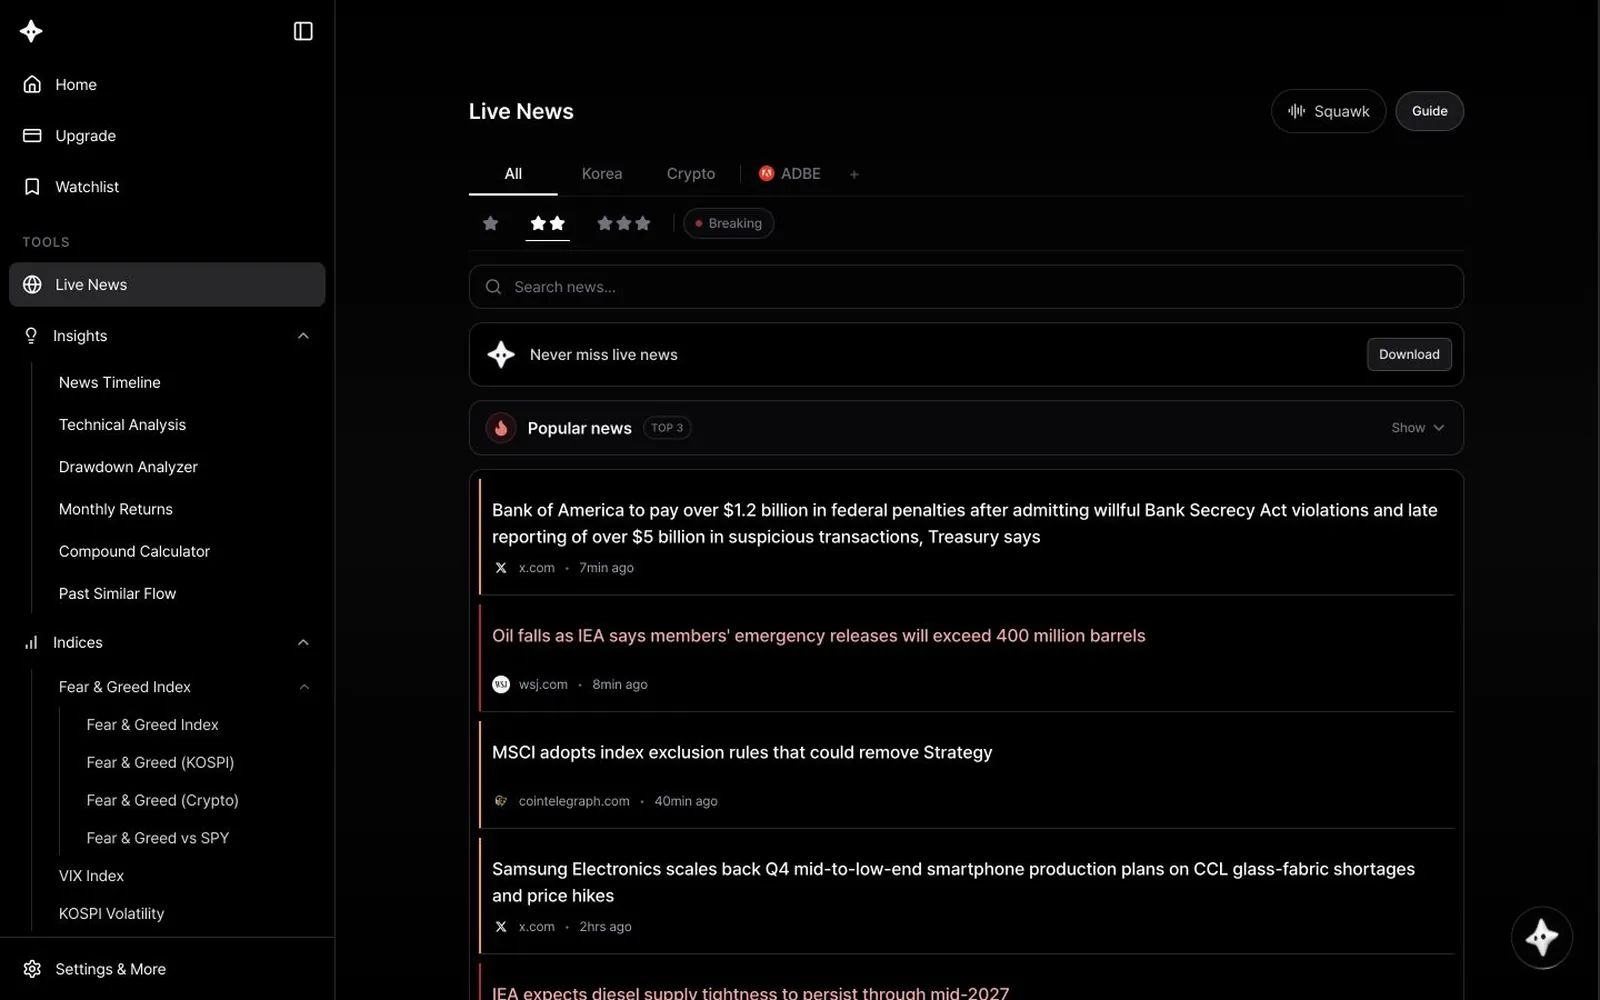
Live News guide
Filter incoming financial news by importance, breaking status and market, then use summaries and AI Research for context.
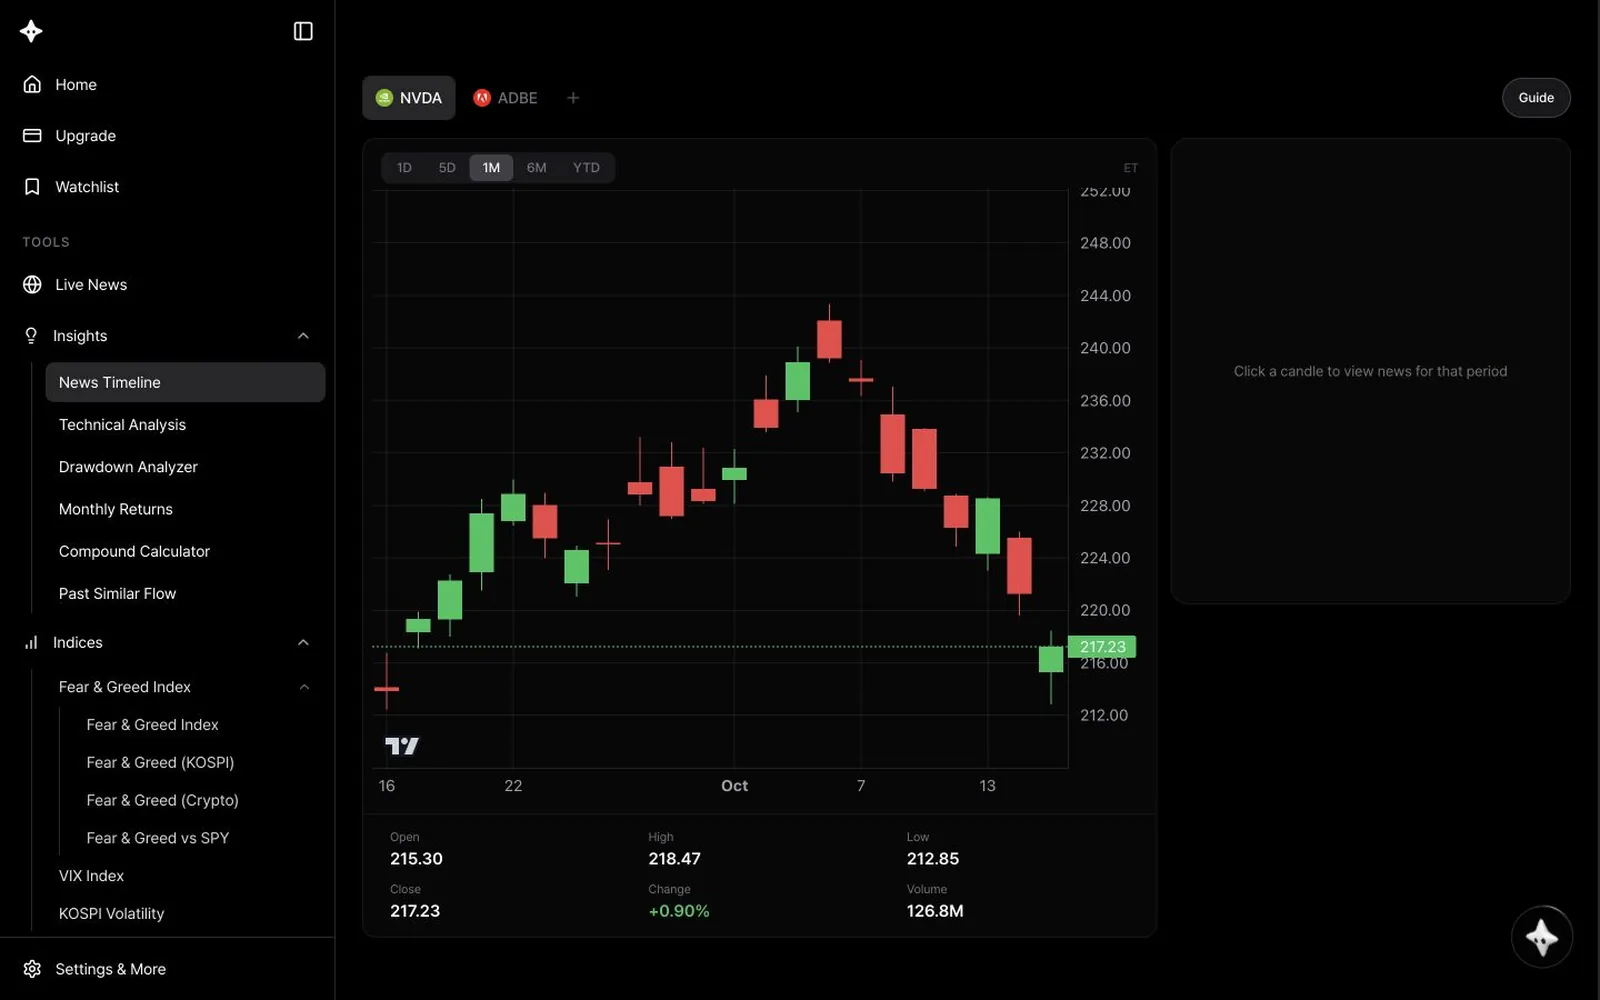
News Timeline guide
Click a candle on the chart to see related news from that period and compare price moves with the news.
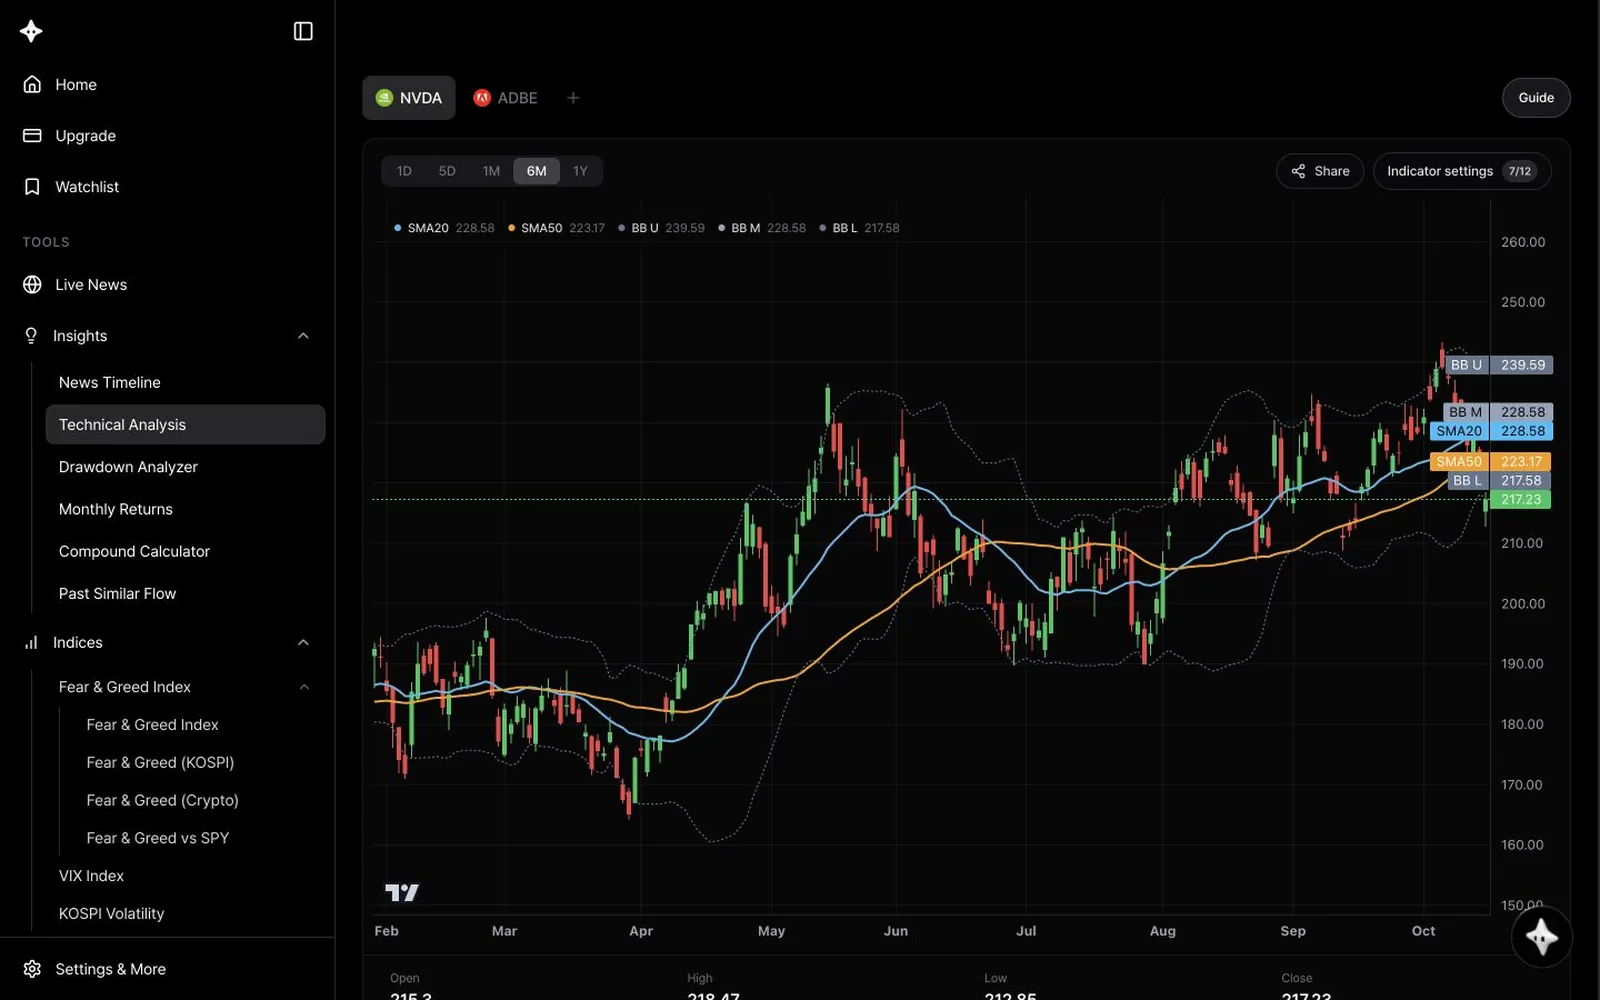
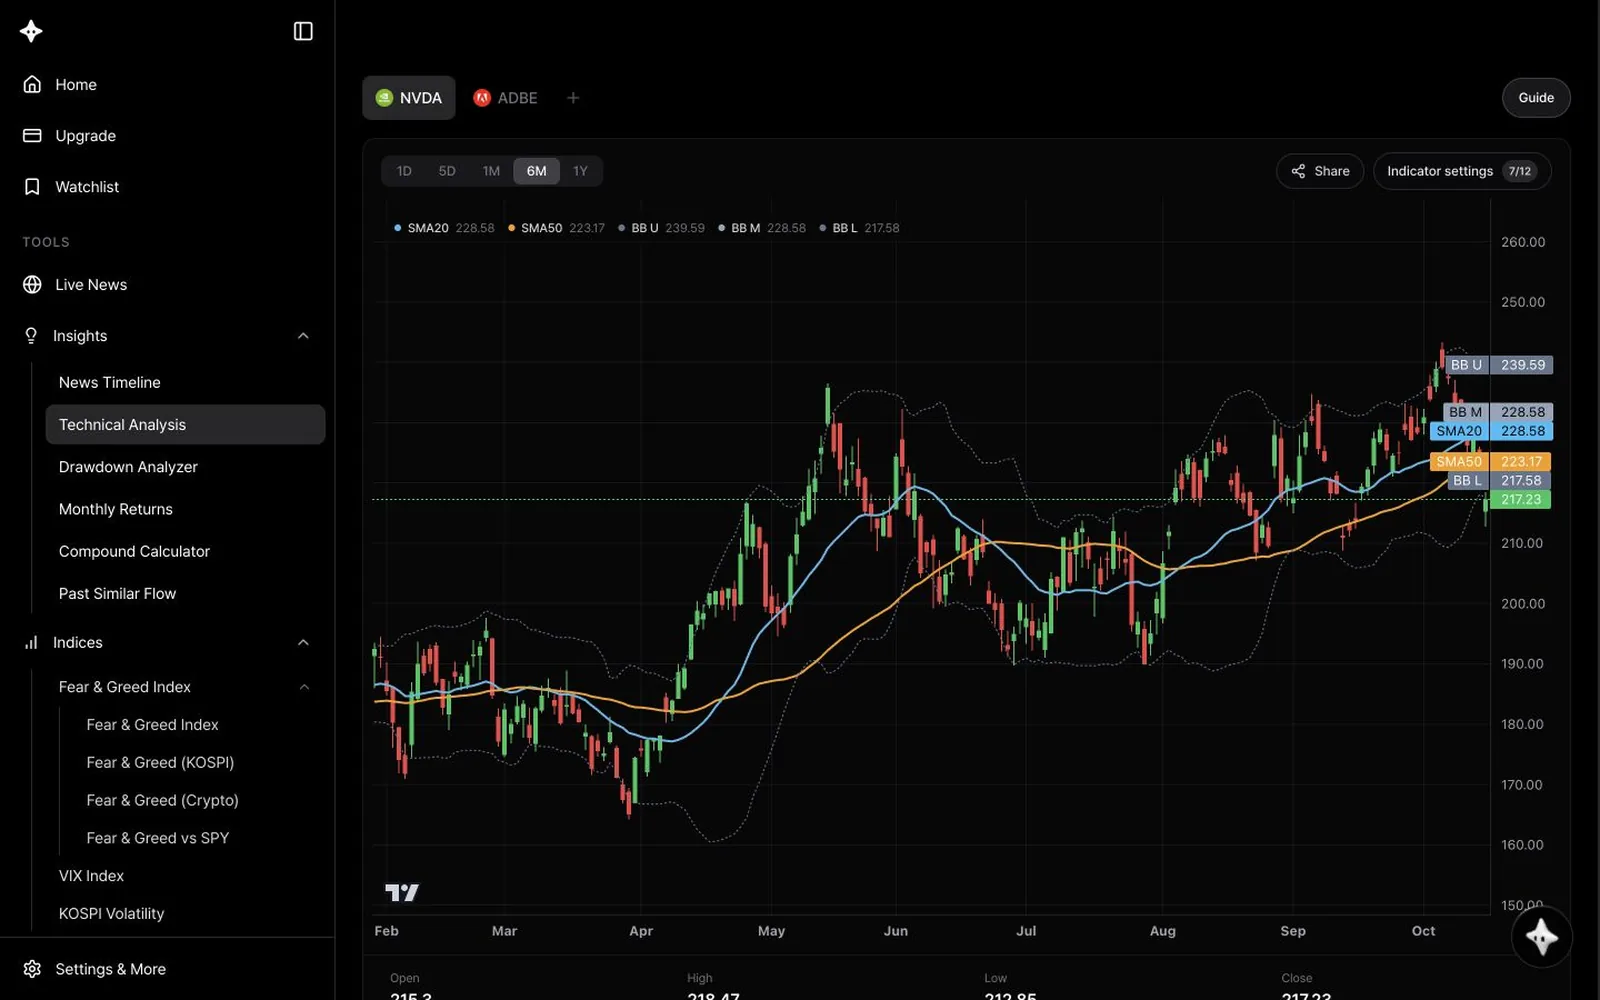
Technical Analysis guide
Pick up to 12 of 38 technical indicators, show them on and below a candlestick chart, and read trend, momentum, volume and volatility on one screen.
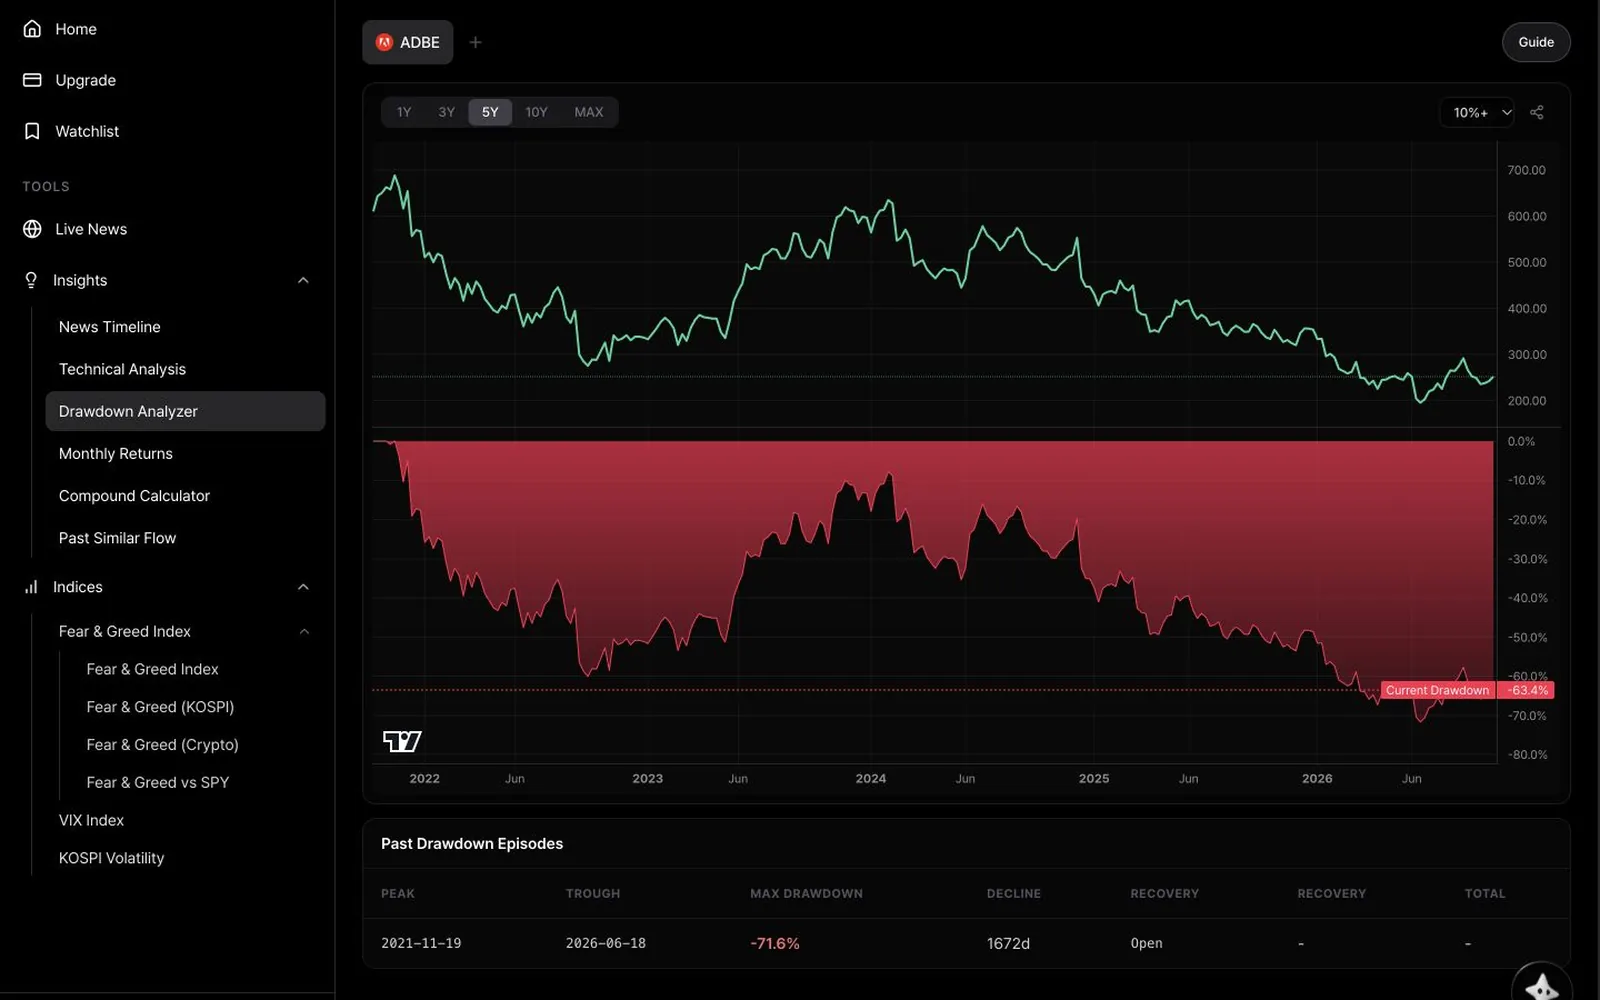
Drawdown Analyzer guide
See how far a stock is below its peak, how deep past declines went and how long they took to recover, with a chart and a table.
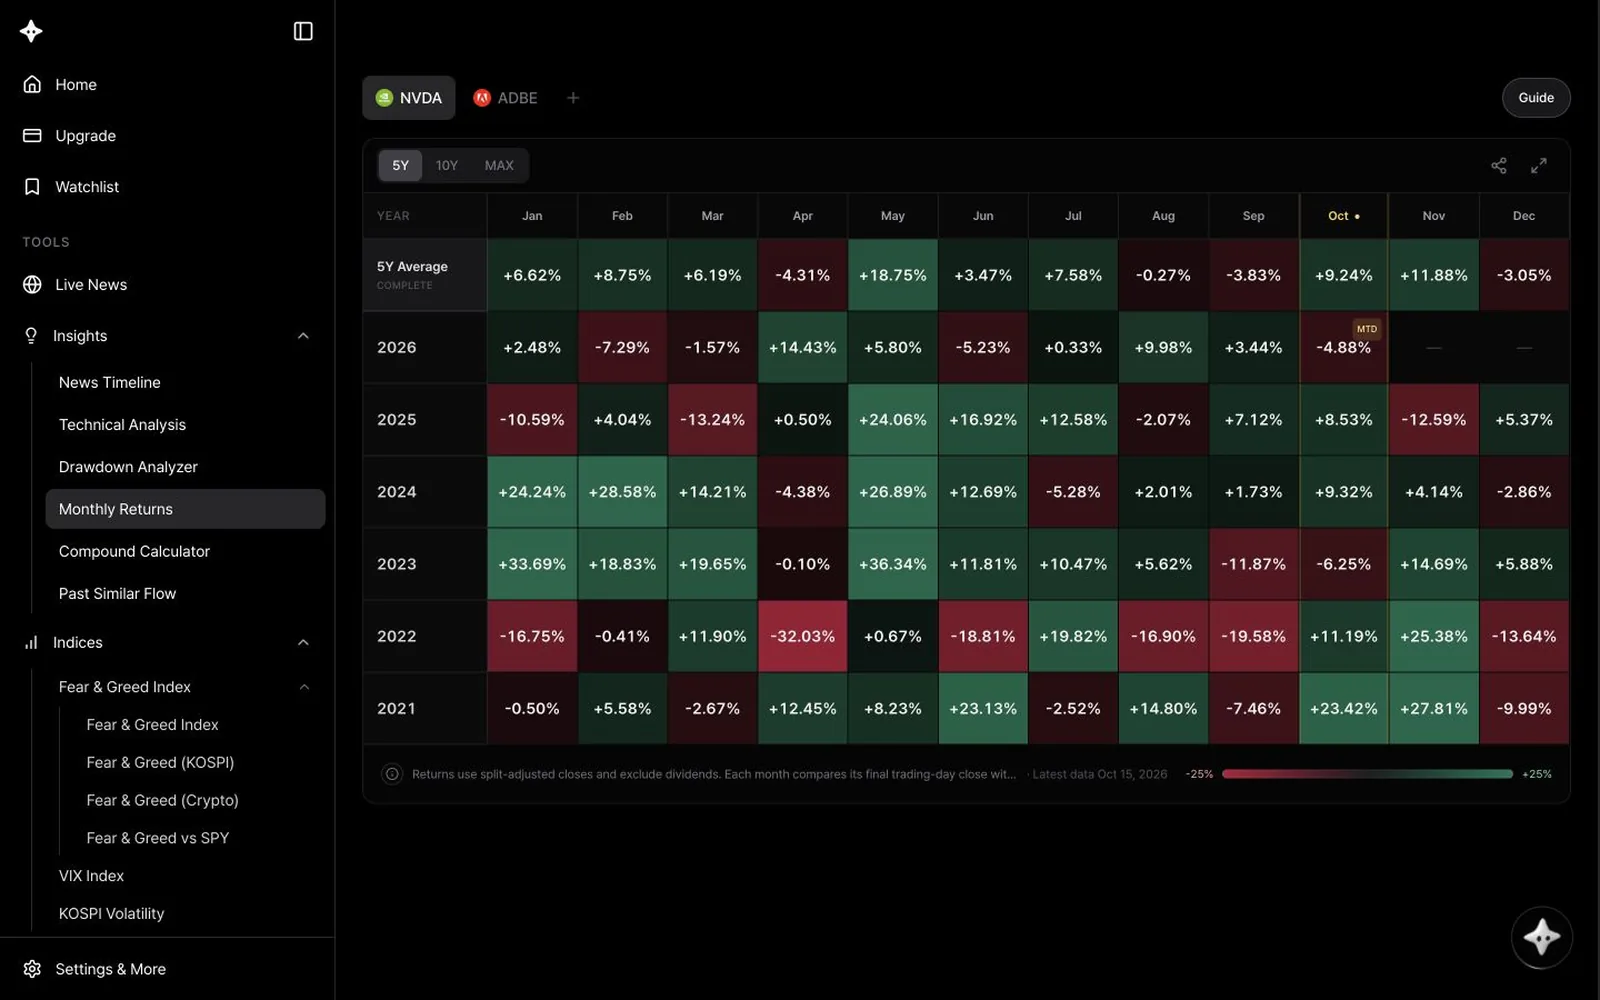
Monthly Returns guide
View a stock's returns by year and month as a heatmap to see which months were strong or weak and how this month compares.
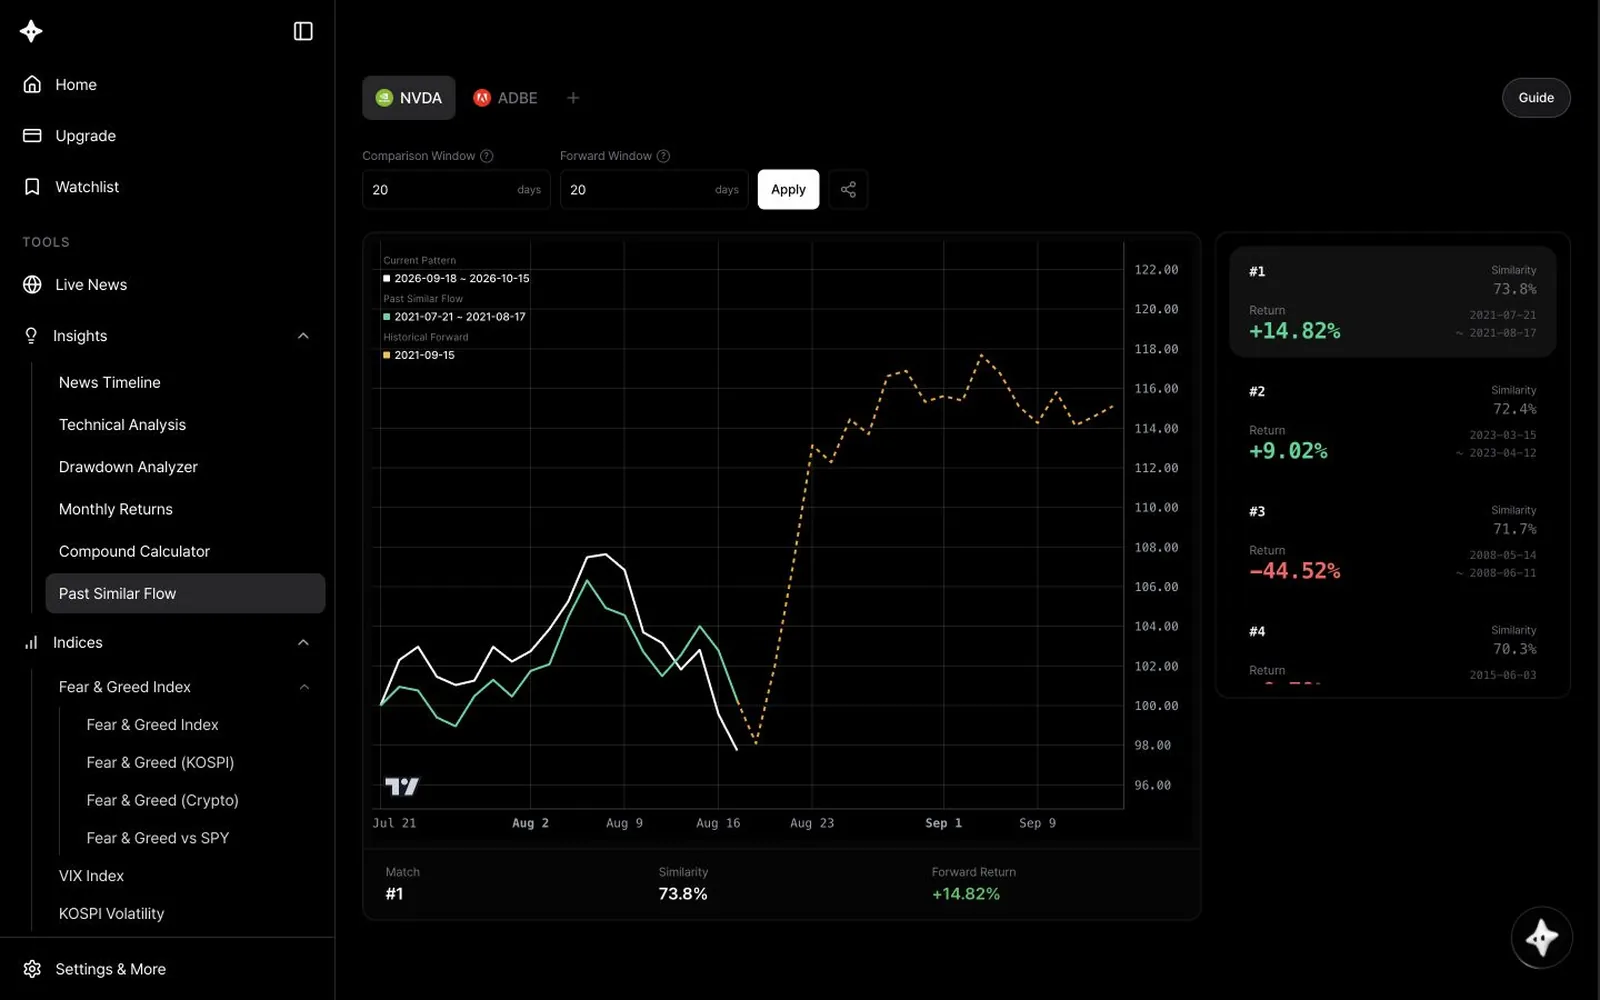
Past Similar Flow guide
Find past periods when the same stock moved like it has recently, and see how its price moved afterward.
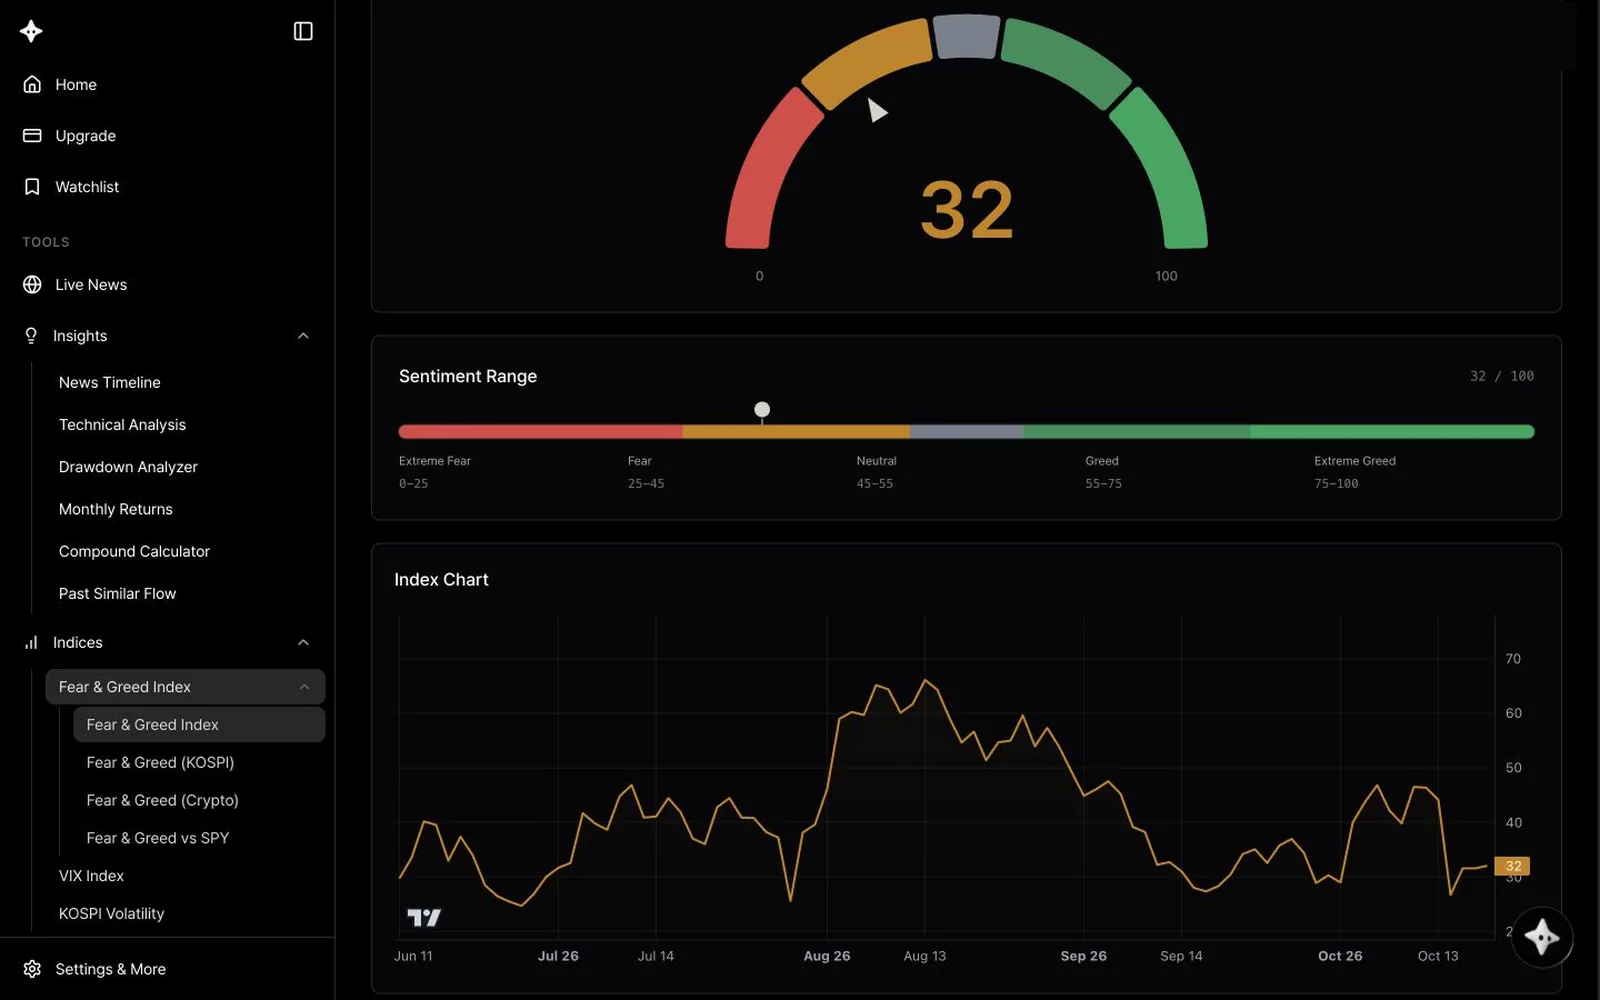
Market sentiment indexes guide
What the US, KOSPI and crypto Fear & Greed indexes, the VIX and the KOSPI Volatility Index mean, and how to read their ranges.
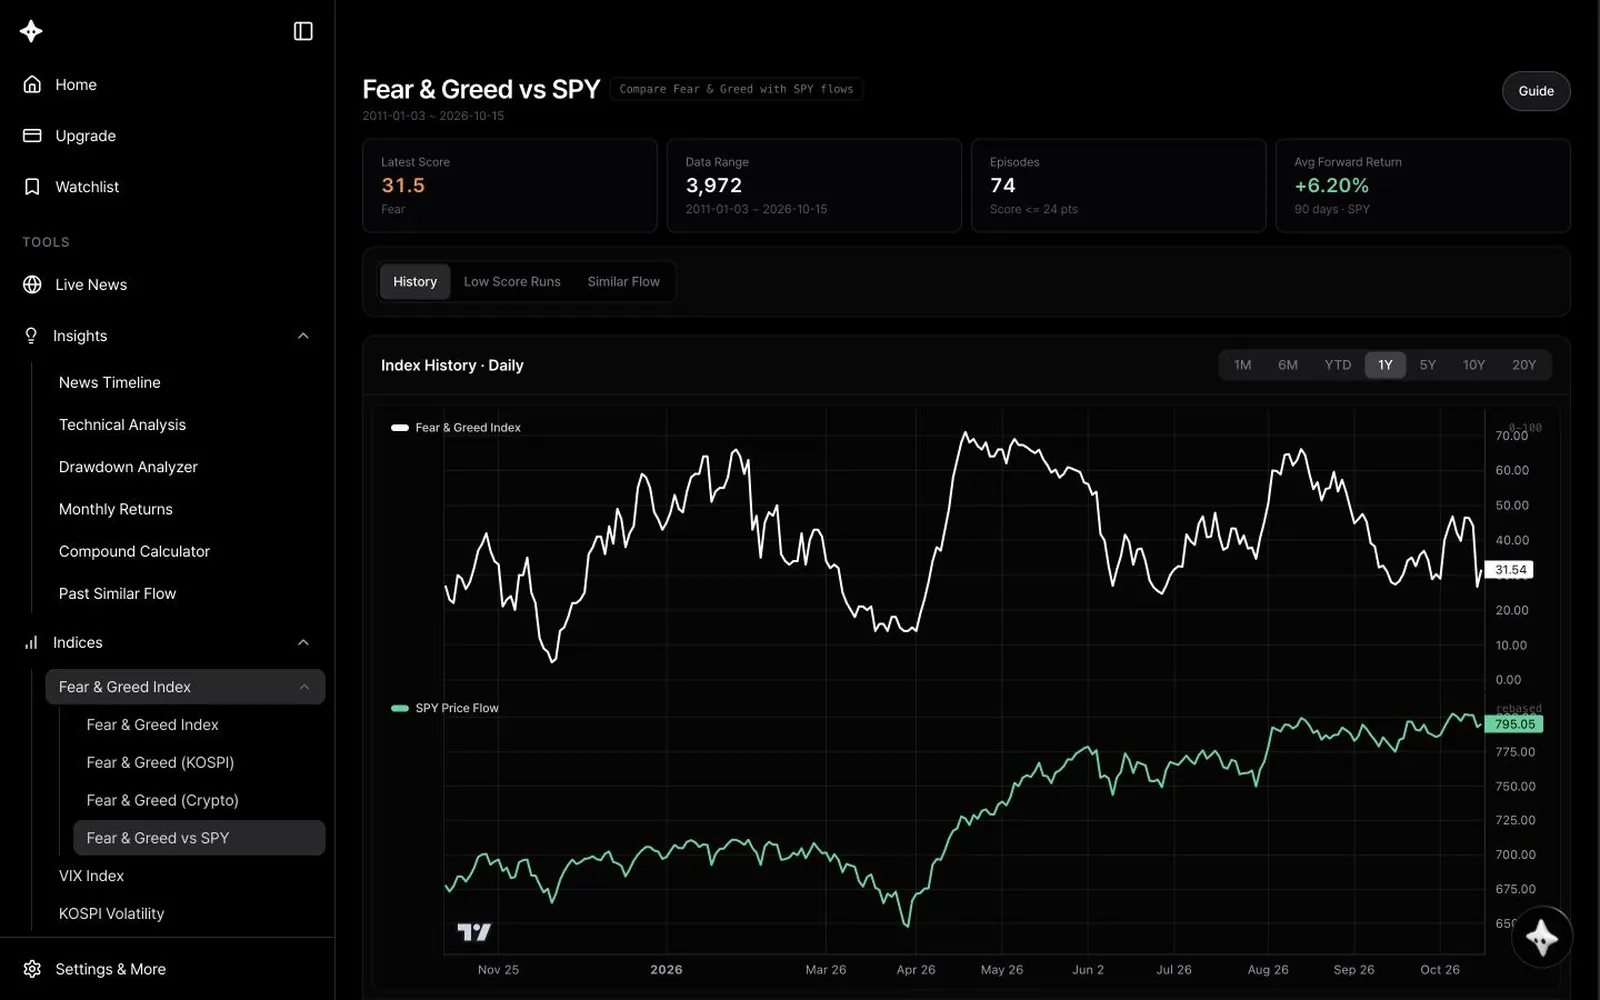
Fear & Greed vs SPY guide
Compare how SPY moved after low Fear & Greed readings or after sentiment patterns like today's.
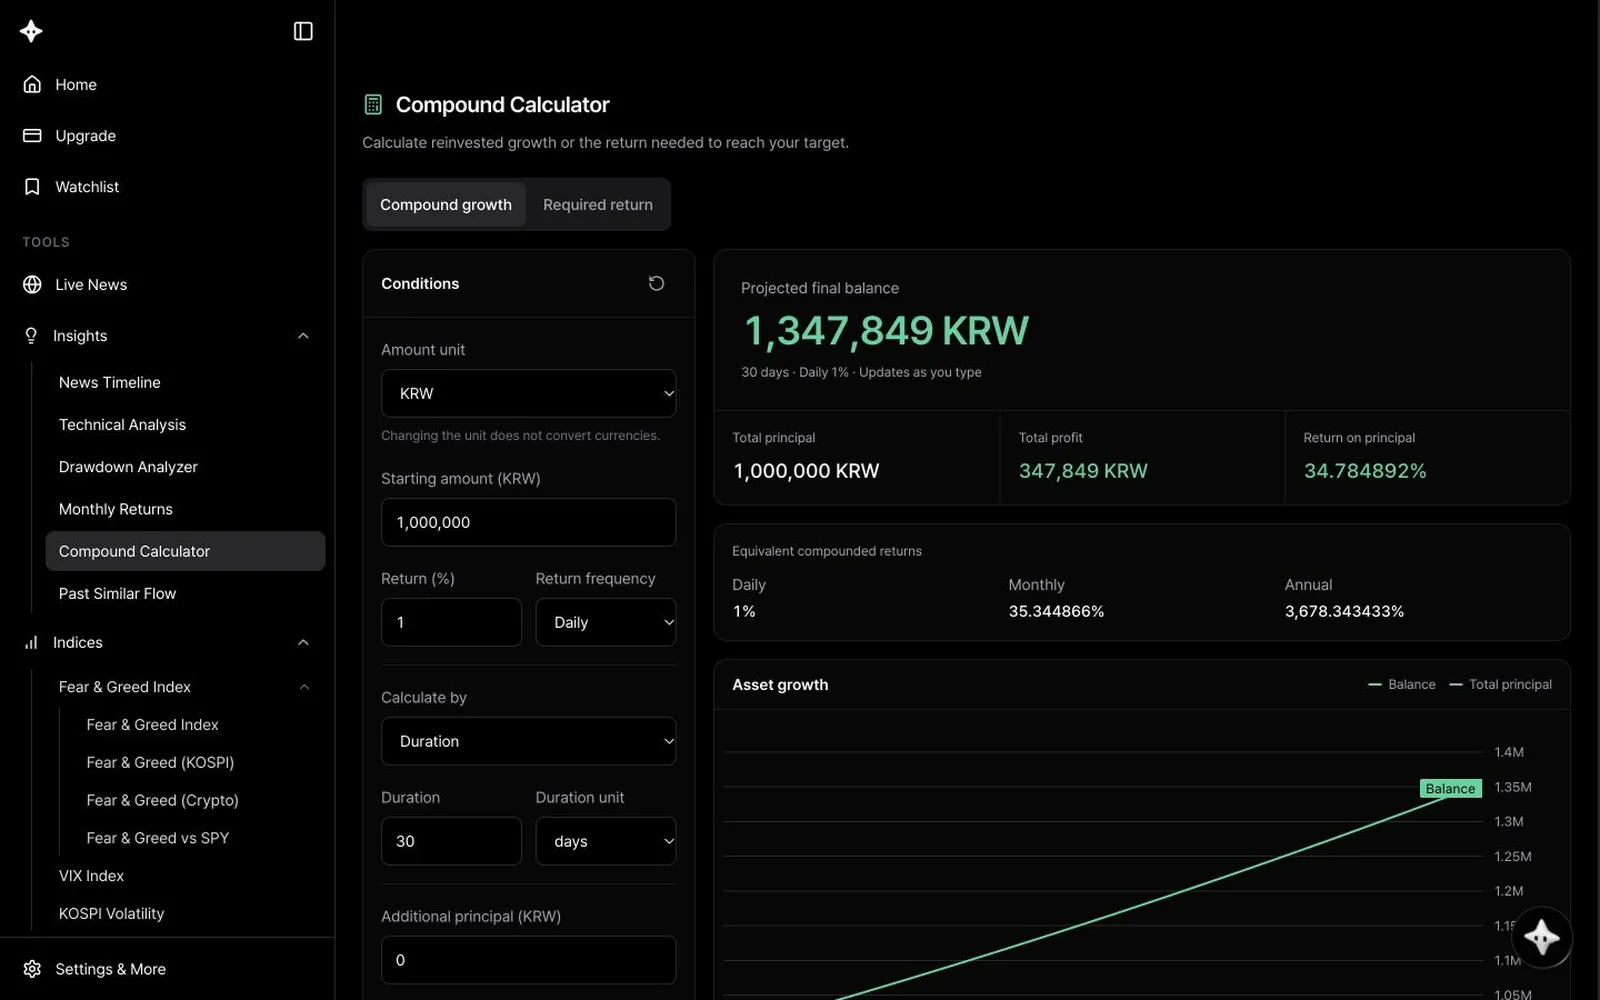
Compound Calculator & DCA Simulator guide
How to use the Compound Calculator for growth at a constant return, and the DCA Simulator to replay recurring investing with real historical prices.