

Market sentiment indexes guide
The market sentiment indexes show at a glance whether the market is leaning toward fear or greed, and how much stress is priced in. There are five: the US, KOSPI and crypto Fear & Greed indexes, the VIX and the KOSPI Volatility Index. Anyone can view them without logging in. Start with the Fear & Greed Index.
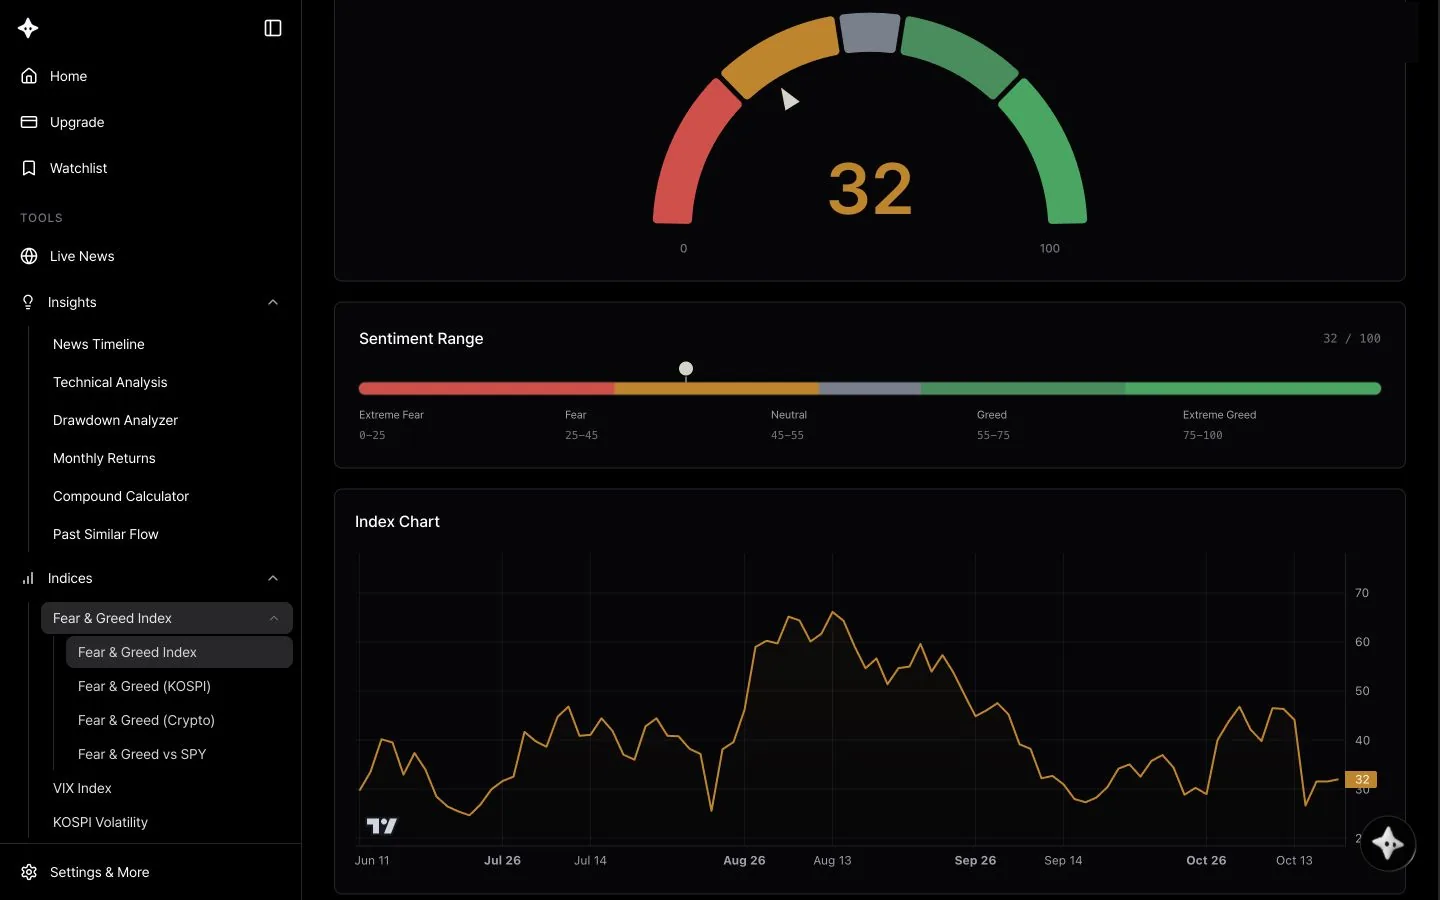
The five indexes at a glance
| Index | What it shows | Scale |
|---|---|---|
| Fear & Greed Index | Fear and greed across the US equity market | 0–100 |
| KOSPI Fear & Greed Index | A blended read on risk appetite and aversion in Korean equities | 0–100 |
| Crypto Fear & Greed Index | Investor sentiment across crypto markets | 0–100 |
| VIX Index | 30-day expected S&P 500 volatility implied by options | Gauge 0–40 |
| KOSPI Volatility Index | Expected Korean equity volatility implied by KOSPI 200 options | 0–100 |
The three Fear & Greed indexes blend several sentiment inputs into a single 0–100 score. Only the overall score is shown; individual component scores and weights are not displayed. The VIX and KOSPI Volatility Index directly track option-implied volatility, and higher values mean more market stress.
Screen layout
- Index name and description: a one-line description sits under the name, and the Guide button opens this guide in a new tab. To switch indexes, use the index menu in the left sidebar.
- Current value: the Updated time, plus the 1D Change when available.
- Gauge: a semicircular gauge with the current value in large numbers.
- Sentiment Range: shows where the current value sits on the full scale, with every range and its label listed below.
- Index Chart: a line chart of up to the latest 90 data points. Hover or touch to see the date and value. The Crypto Fear & Greed Index has no chart.
- FAQ: three index-specific questions you can expand.
How to read it
All three Fear & Greed indexes (US, KOSPI and crypto) use the same ranges.
| Range | Score |
|---|---|
| Extreme Fear | 0–25 |
| Fear | 25–45 |
| Neutral | 45–55 |
| Greed | 55–75 |
| Extreme Greed | 75–100 |
Lower scores point to fear and risk aversion; higher scores point to greed and stronger risk appetite. Boundary values such as 25 and 45 are scale markers, so treat readings right at a boundary as approximate.
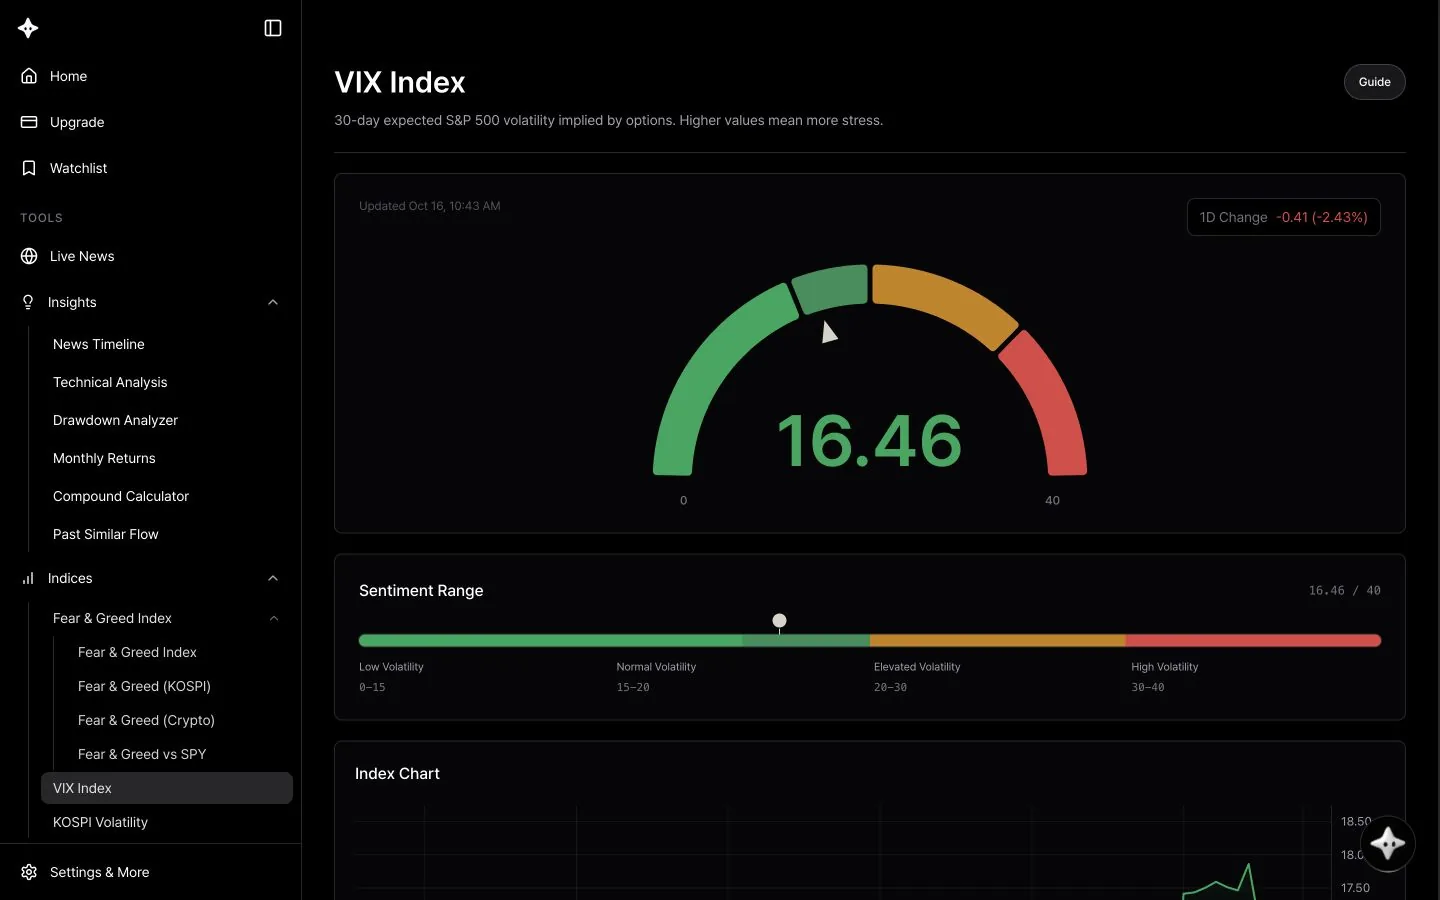
VIX Index ranges: 0–15 Low Volatility, 15–20 Normal Volatility, 20–30 Elevated Volatility, 30–40 High Volatility. Readings of 40 or more are classed as Extreme Volatility, but the gauge scale ends at 40.
KOSPI Volatility Index ranges: 0–25 Low Volatility, 25–45 Normal Volatility, 45–60 Elevated Volatility, 60–80 High Volatility, 80–100 Extreme Volatility.
These ranges are Byul's display guide, not an official standard. 1D Change shows green when the index rises and red when it falls. On the volatility indexes, green (rising) means stress is increasing.
Tips
- Treat extreme fear as a prompt to check for oversold conditions and extreme greed as a prompt to check for overheating. Confirm with trend, rates, earnings and volume.
- Pair the US Fear & Greed Index with the VIX, and KOSPI Fear & Greed with the KOSPI Volatility Index, to read sentiment and stress together.
- A VIX spike is not always a buying opportunity. Stress can persist, so look at the index trend and upcoming macro events too.
- Longer-term investors can use sharp regime changes as context for rebalancing rather than checking daily.
Use with AI Research
On any index page, open AI Research at the bottom right and it explains the current market mood based on the index you are viewing.
- "Analyze the Fear & Greed Index"
- "Compare the Fear & Greed Index with the VIX and explain market sentiment"
- "What's the difference between the KOSPI and US Fear & Greed indexes?"
Learn more about using AI Research with market sentiment indexes
Good to know
- The Updated time is shown in your device's time zone, and values are as of when you opened the page. Reopen the page to see the latest value.
- The chart shows up to the latest 90 data points and is not guaranteed to be an unbroken daily series.
- Sentiment indexes describe the overall market mood for reference. They are not buy or sell signals for individual stocks and not investment advice.