

AI Research Guide
AI Research is an investment research assistant that understands your question, finds the data it needs and answers with the key points. It looks across Byul's live news, the web, stock prices, market indexes and chart indicators at once.
This guide gives you an overview of every feature and how to get started. For detailed instructions and example questions on each topic, see the guides below.
What you can do
| Feature | How it works | Learn more |
|---|---|---|
| Research news | Finds news from the last day, 3 days or week, and can keep only high-importance or breaking stories. It also searches the web for the latest filings and earnings. | Research news |
| Analyze stocks and companies | Shows a stock card with the current price and chart, compares multiple stocks, and checks similar past patterns and drawdowns from the peak. | Analyze stocks and companies |
| Technical Analysis | Calculates indicators such as RSI, MACD and moving averages, and sets them up on your chart before explaining them. | Technical Analysis |
| News Timeline | Gathers news from the candle period you pick on the chart and explains why the price moved. | News Timeline |
| Drawdown Analyzer | Analyzes the current drawdown, past major declines and how long they took to recover. | Drawdown Analyzer |
| Monthly Returns | Interprets seasonality based on the monthly returns table. | Monthly Returns |
| Past Similar Flow | Analyzes past periods that looked like today and what happened next. | Past Similar Flow |
| Market sentiment indexes | Analyzes Fear & Greed (US, KOSPI and crypto), VIX, KOSPI Volatility and Fear & Greed vs SPY. | Market sentiment indexes |
| Mobile app | Ask from the AI Research tab in the app, or straight from news and the calendar. | Mobile app |
Get started on the web
- Log in on any tool page.
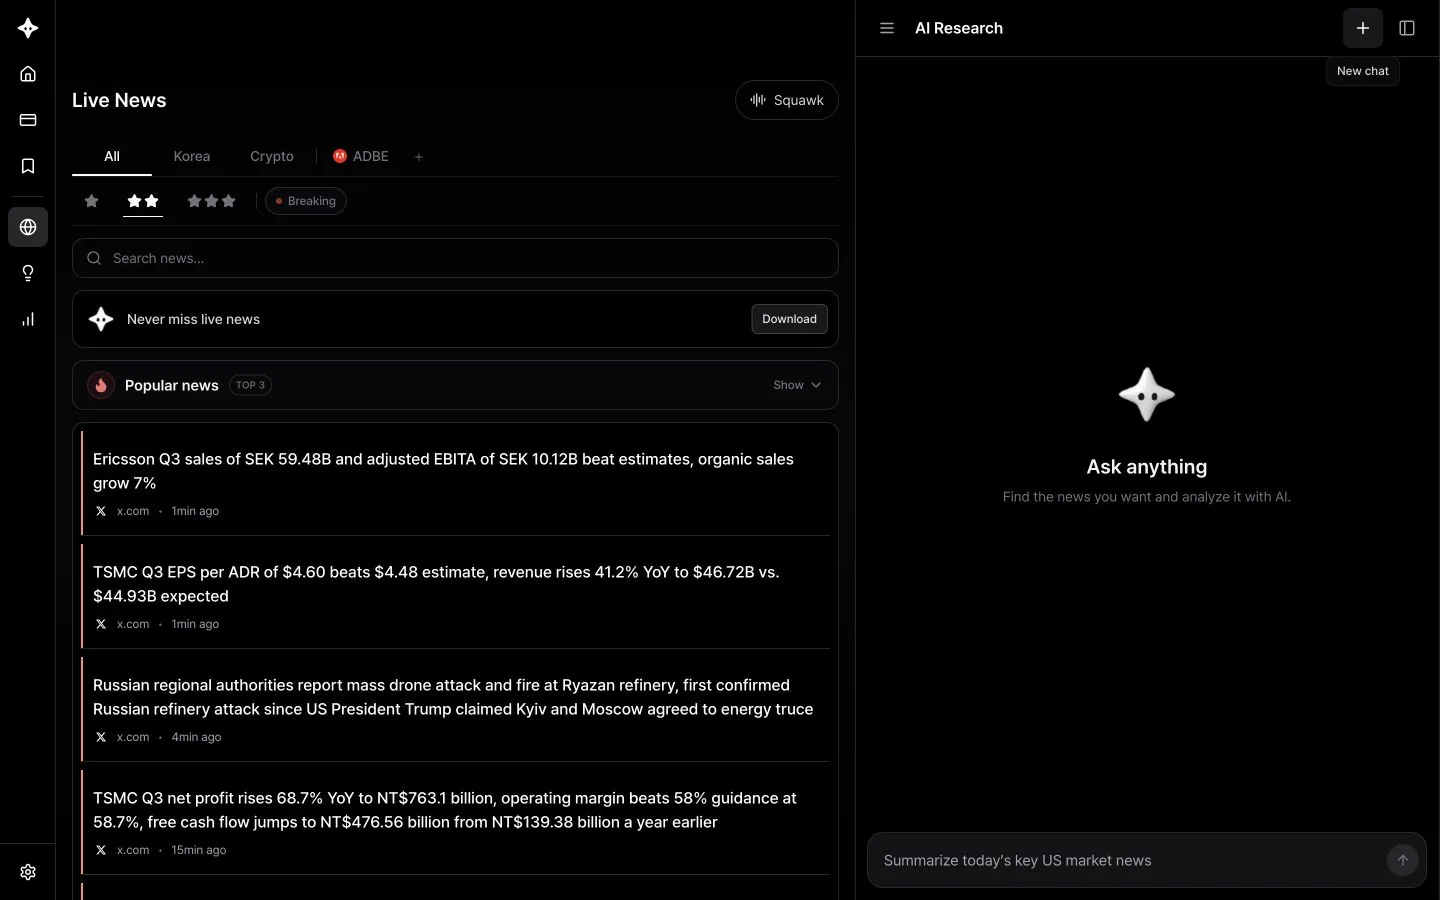
- Click the Byul avatar button (AI Research) at the bottom right. It opens automatically the first time after you log in.
- Type your question and send it. Use the + button at the top to start a new chat, and the menu button to open past chats.
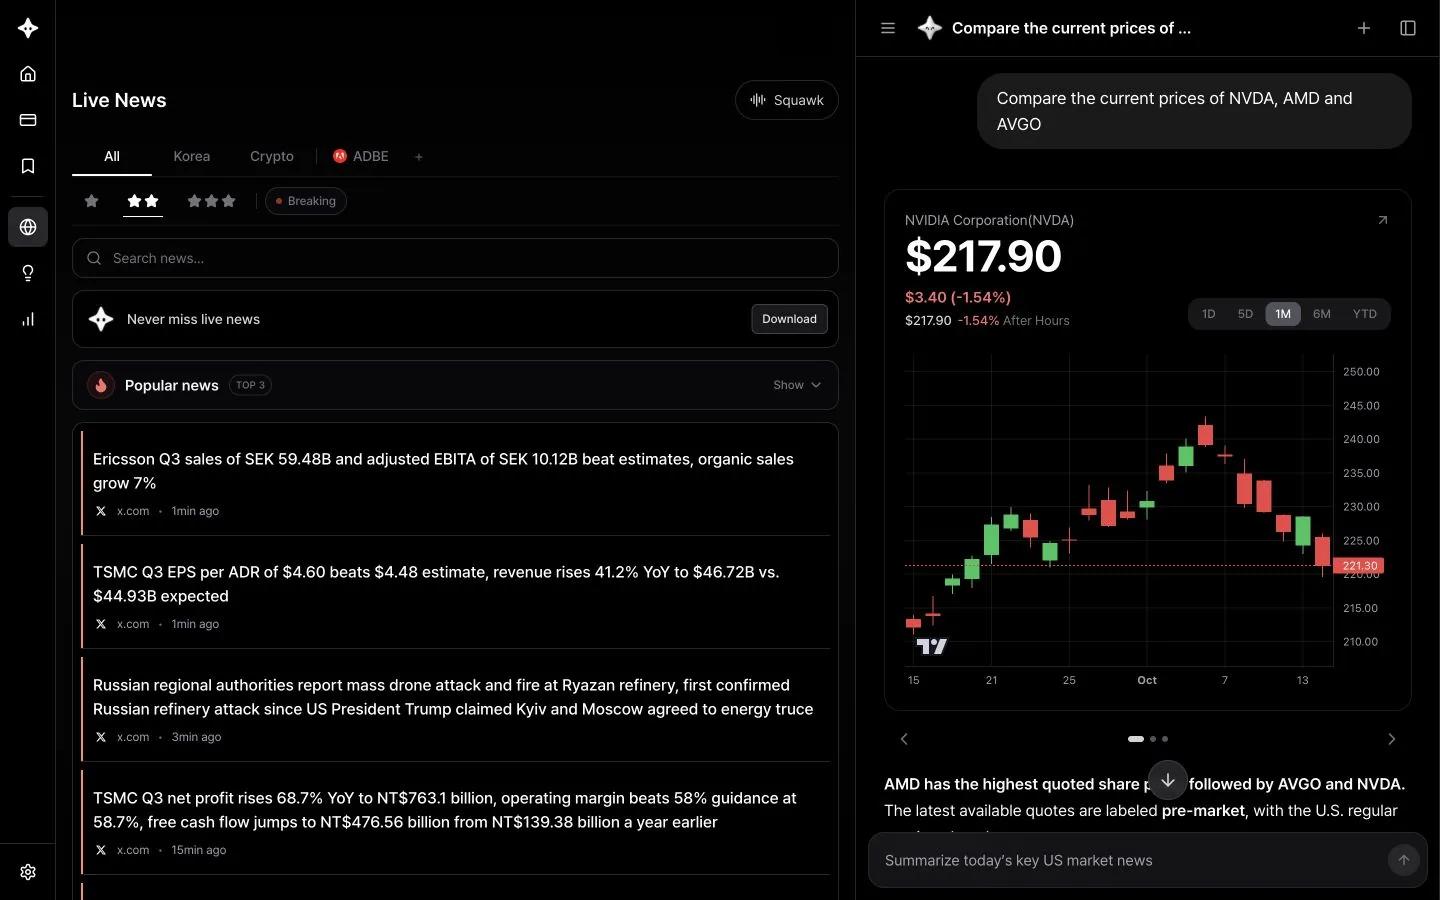
When you open AI Research on a tool page, the symbol, period and indicator values on your screen are sent along with your question. You can say "this chart" or "this screen" and it knows what you mean. Stock tools such as Technical Analysis and News Timeline work with the stocks on your watchlist, while in chat you can ask about any stock. Each guide covers how to use it with a specific tool.
Reading an answer
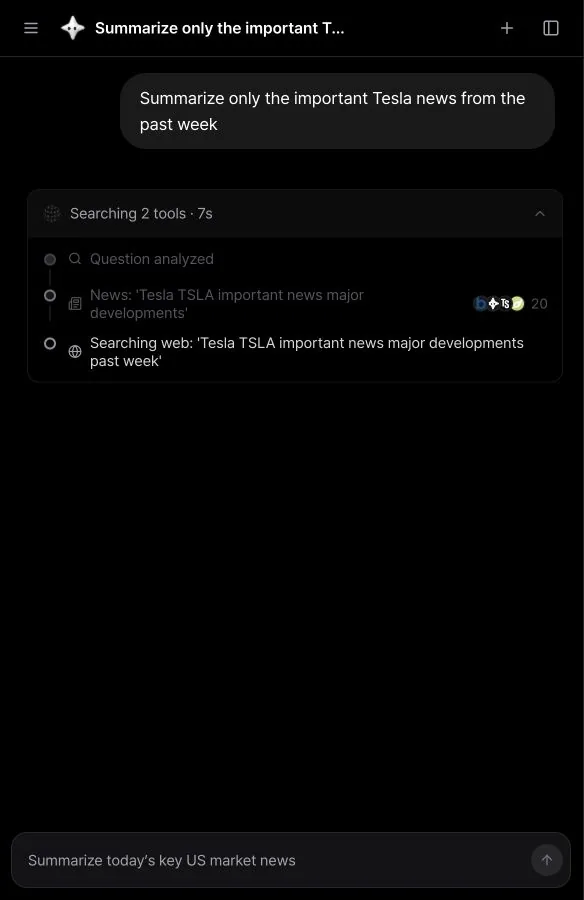
While an answer is being prepared, you can follow each step, including which news and web searches it is running.
- Stock card: Ask about a stock and its current price, change and a chart by period appear above the answer. On the web, click the card to open that stock's News Timeline.
- Similar pattern card: Ask about similar past patterns and the matching periods and their subsequent returns appear as a card.
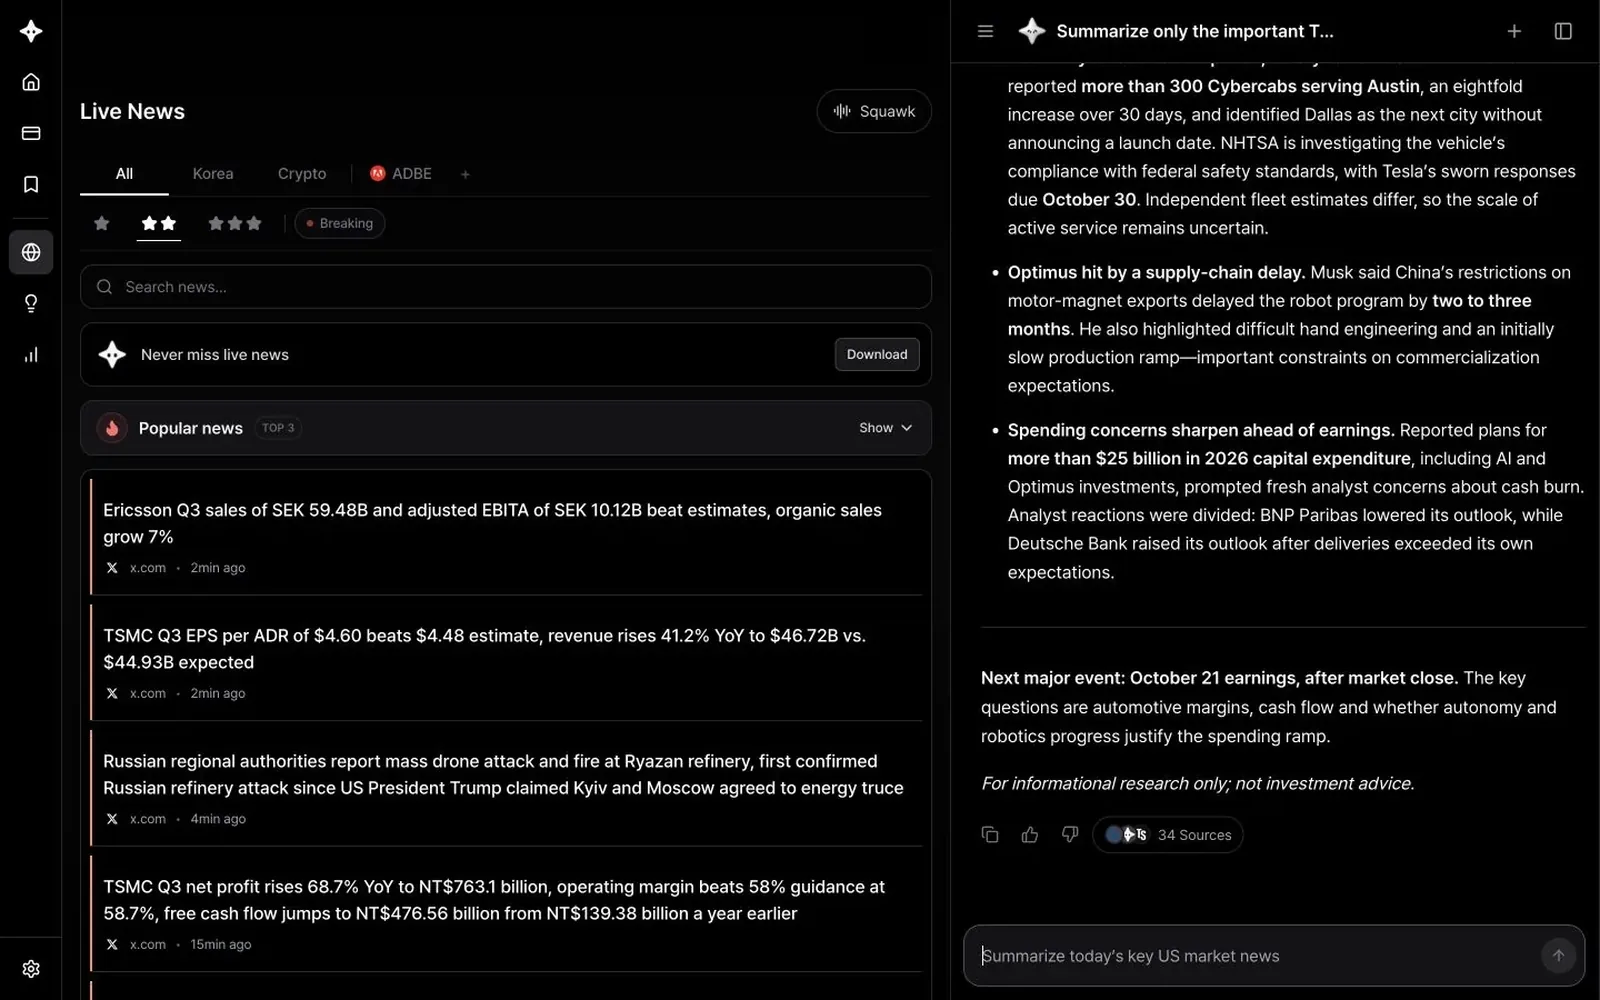
- Sources: Click the Sources button below an answer to see the news and web pages it used.
Tips for better questions
- Include a stock and a time frame. "Important Tesla news from the past week" works better than "Tesla news."
- Ask for a format. Try "compare in a table," "summarize in three lines" or "explain it for a beginner."
- Ask follow-ups. AI Research remembers earlier messages in the same chat, so you can ask "Which one matters most?" or "What's the opposing view?"
- Start a new chat for a new topic. When you switch topics, the + button gives you more accurate answers.
Good to know
- AI Research requires you to log in and is available on the free plan.
- Each question uses credits. Questions that also search the web can use additional credits. Credits recharge monthly; to use more, see plans.
- Answers come in the language you ask in.
- AI Research is for information only and does not recommend buying or selling any security. Check the sources and make your own investment decisions.
Guide contents
Research News with AI Research
Find news by time frame, stock and importance, and use web search to check earnings and filings.
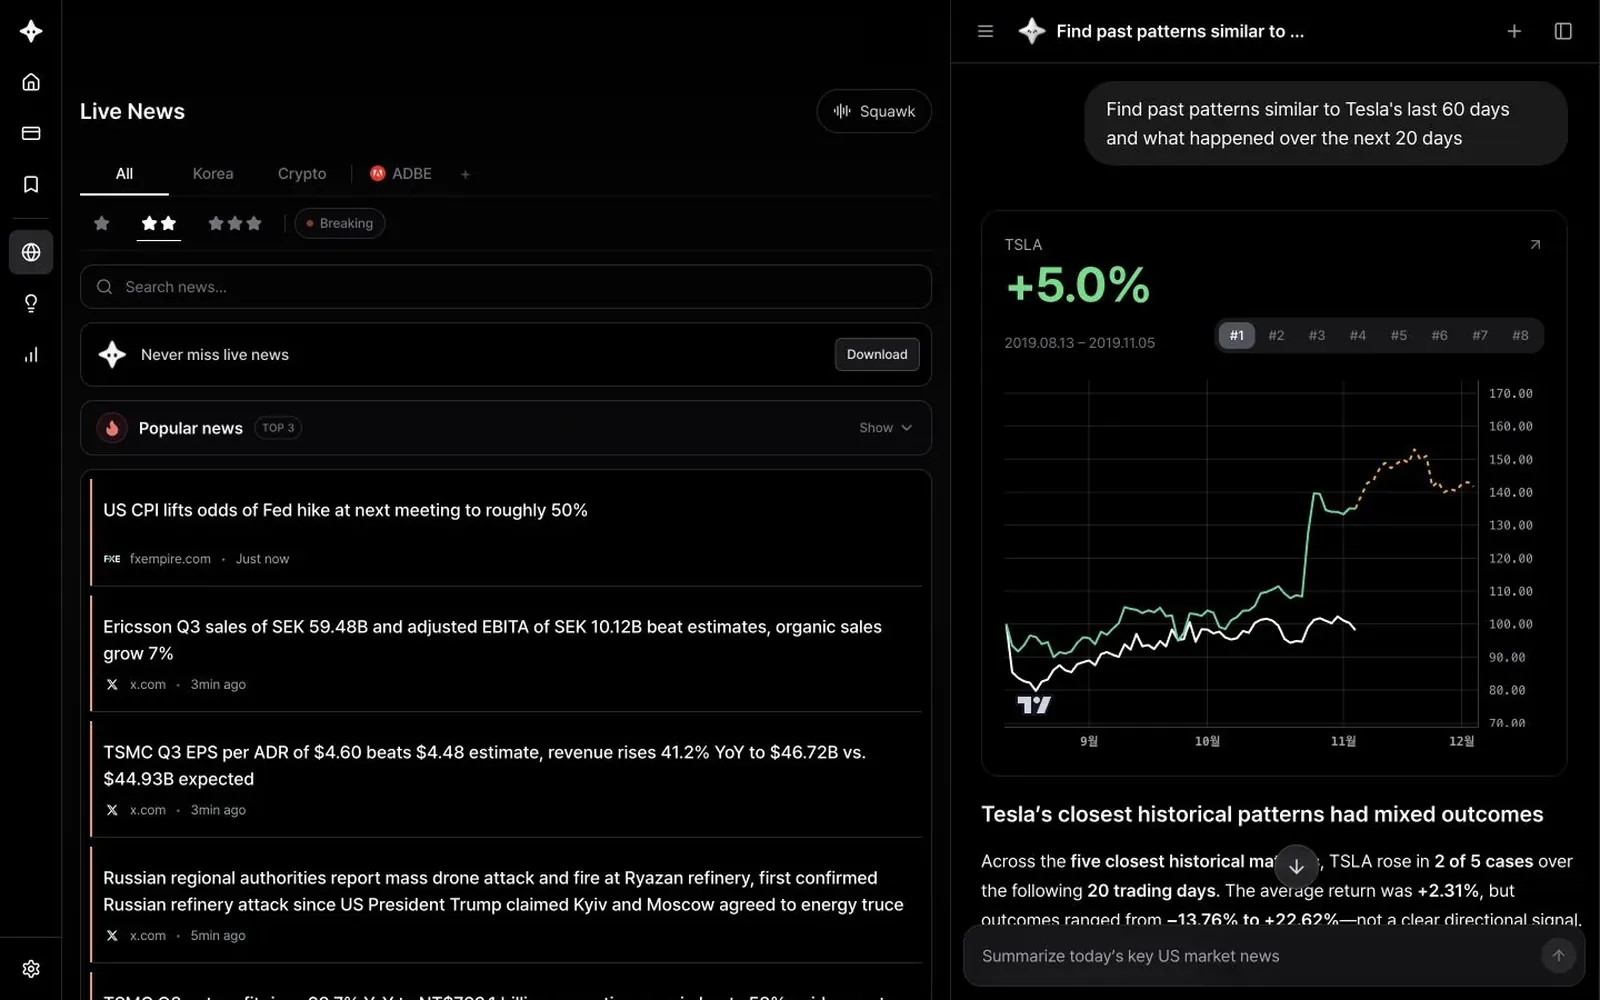
Analyze Stocks and Companies with AI Research
Check stock cards and charts, compare stocks, analyze companies, and look at similar past patterns and drawdowns, all in a chat.
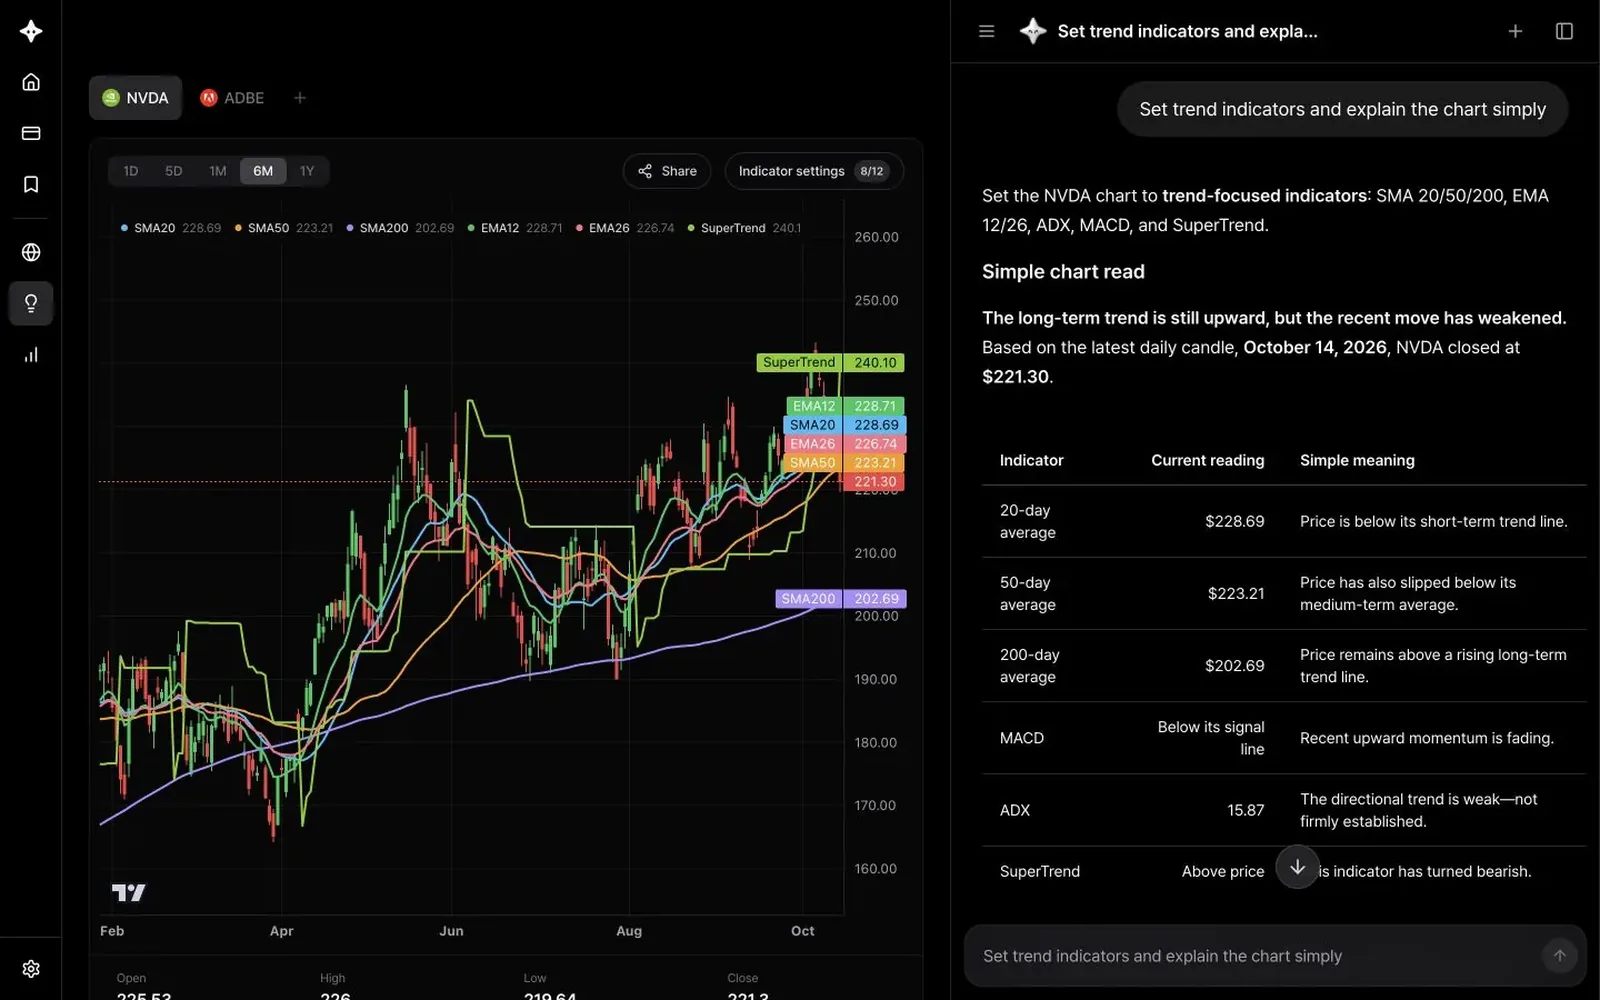
Use AI Research in Technical Analysis
Tell the AI which indicators to set up, and get a plain-language reading of the indicator values on your chart.
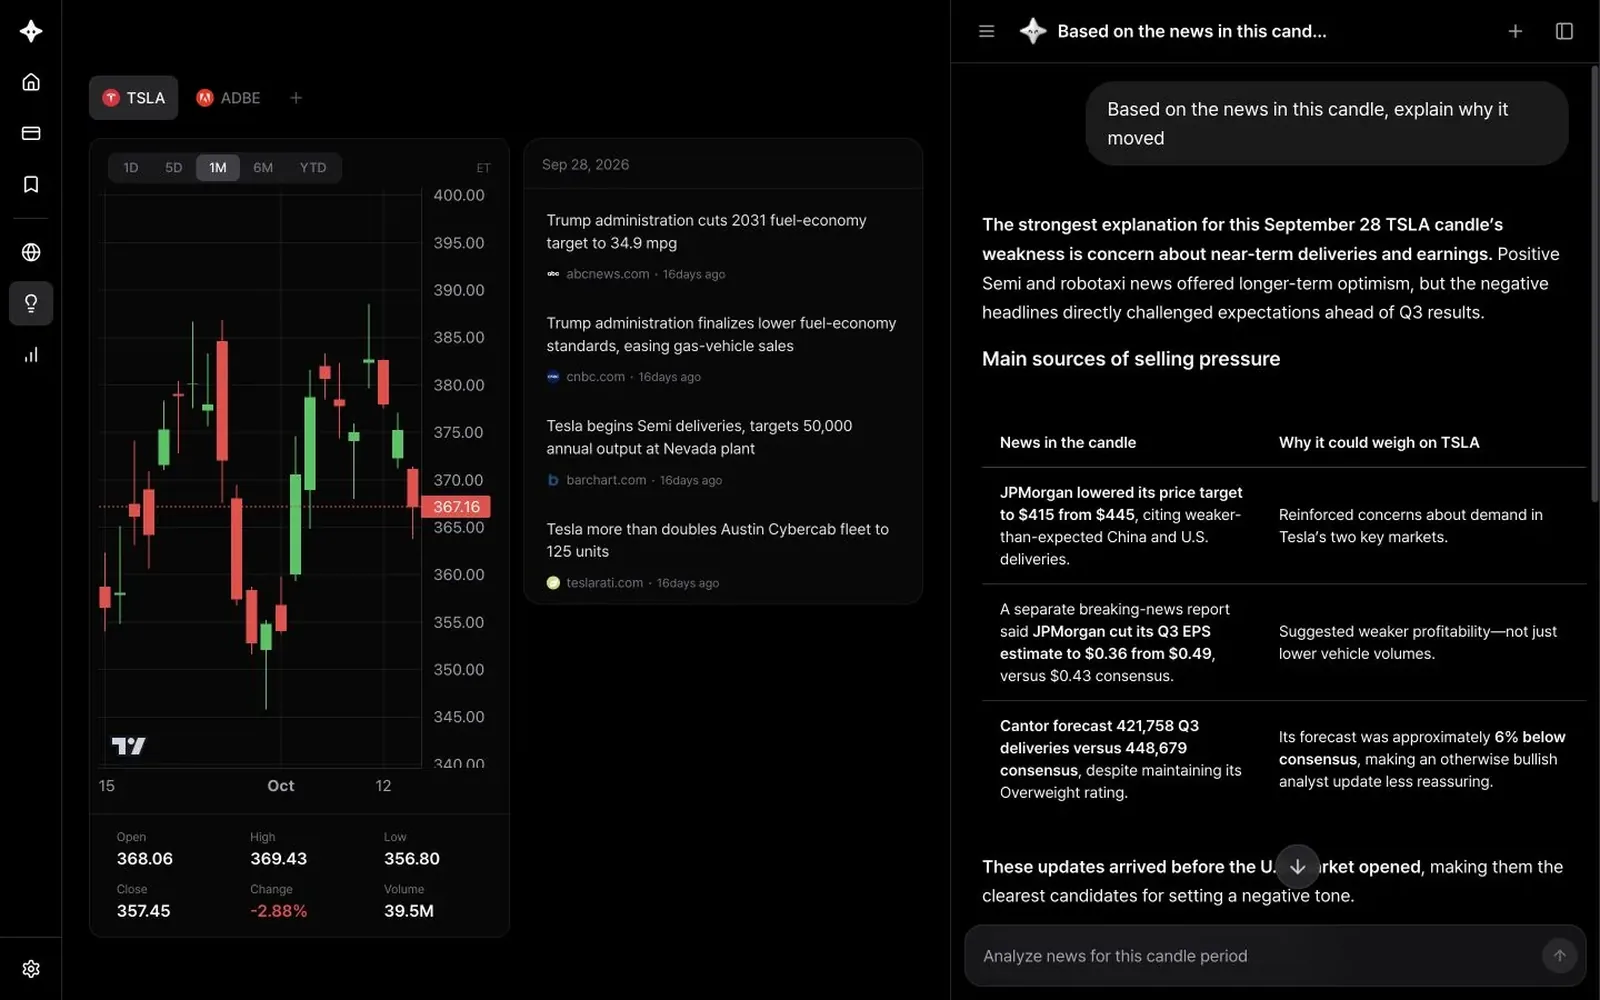
Use AI Research in News Timeline
Pick a candle on the chart and find out why the price moved, based on news from that period.
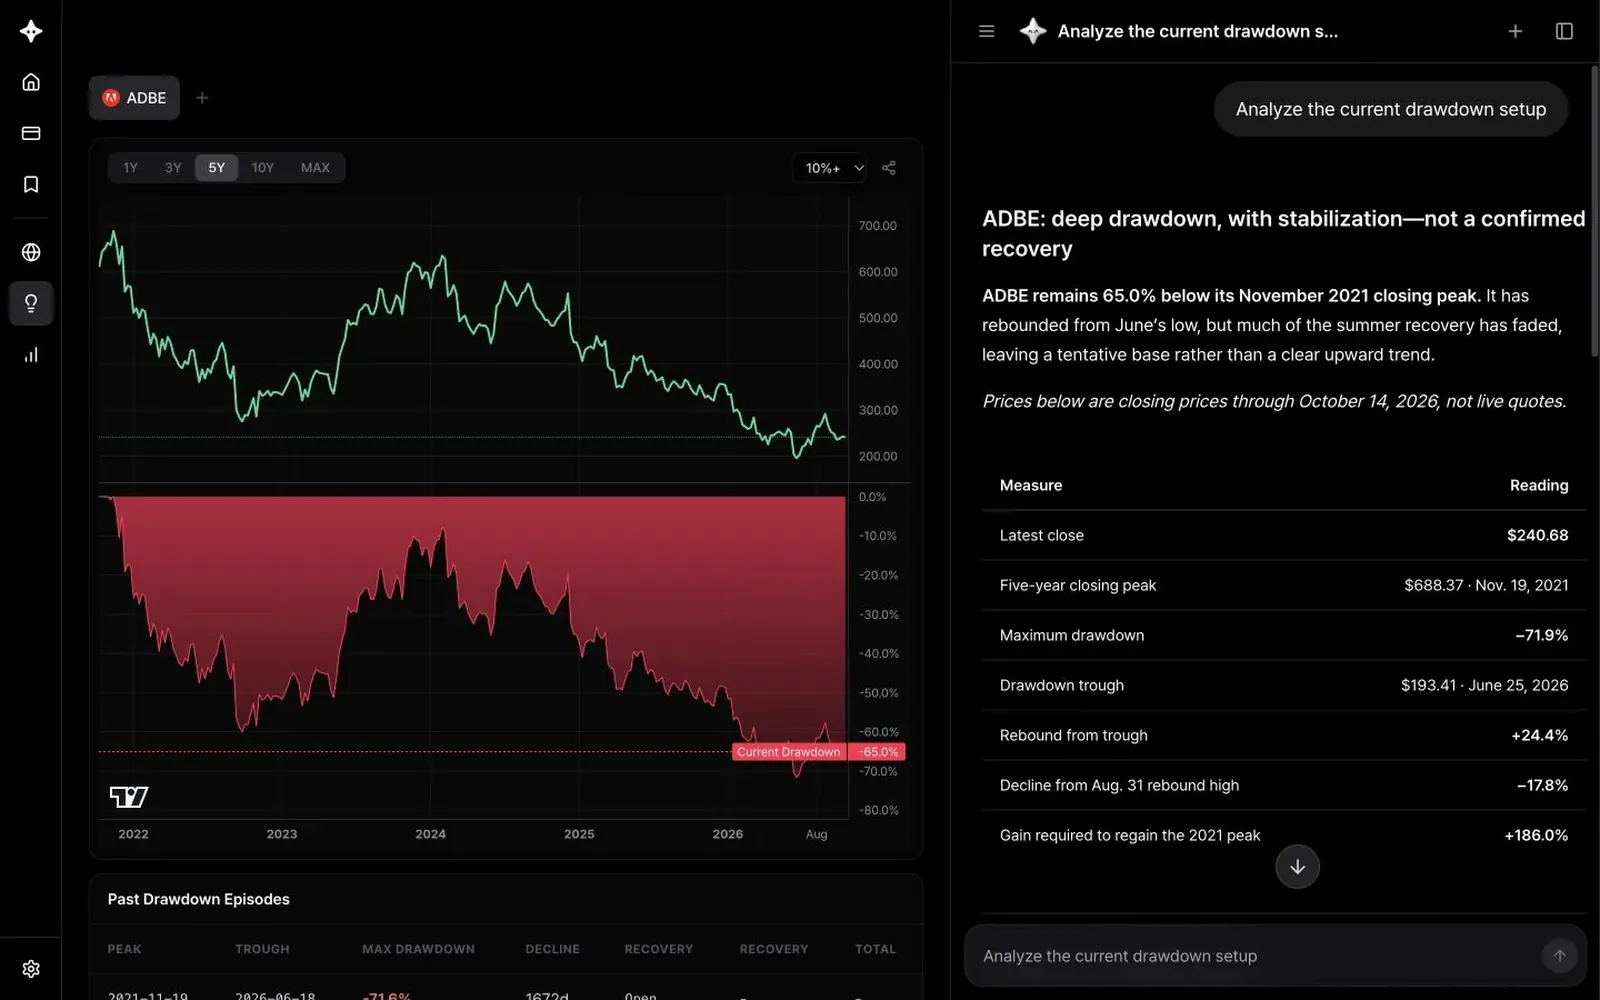
Use AI Research in Drawdown Analyzer
Use AI to see how far a stock is below its peak, how deep past declines went and how long they took to recover.
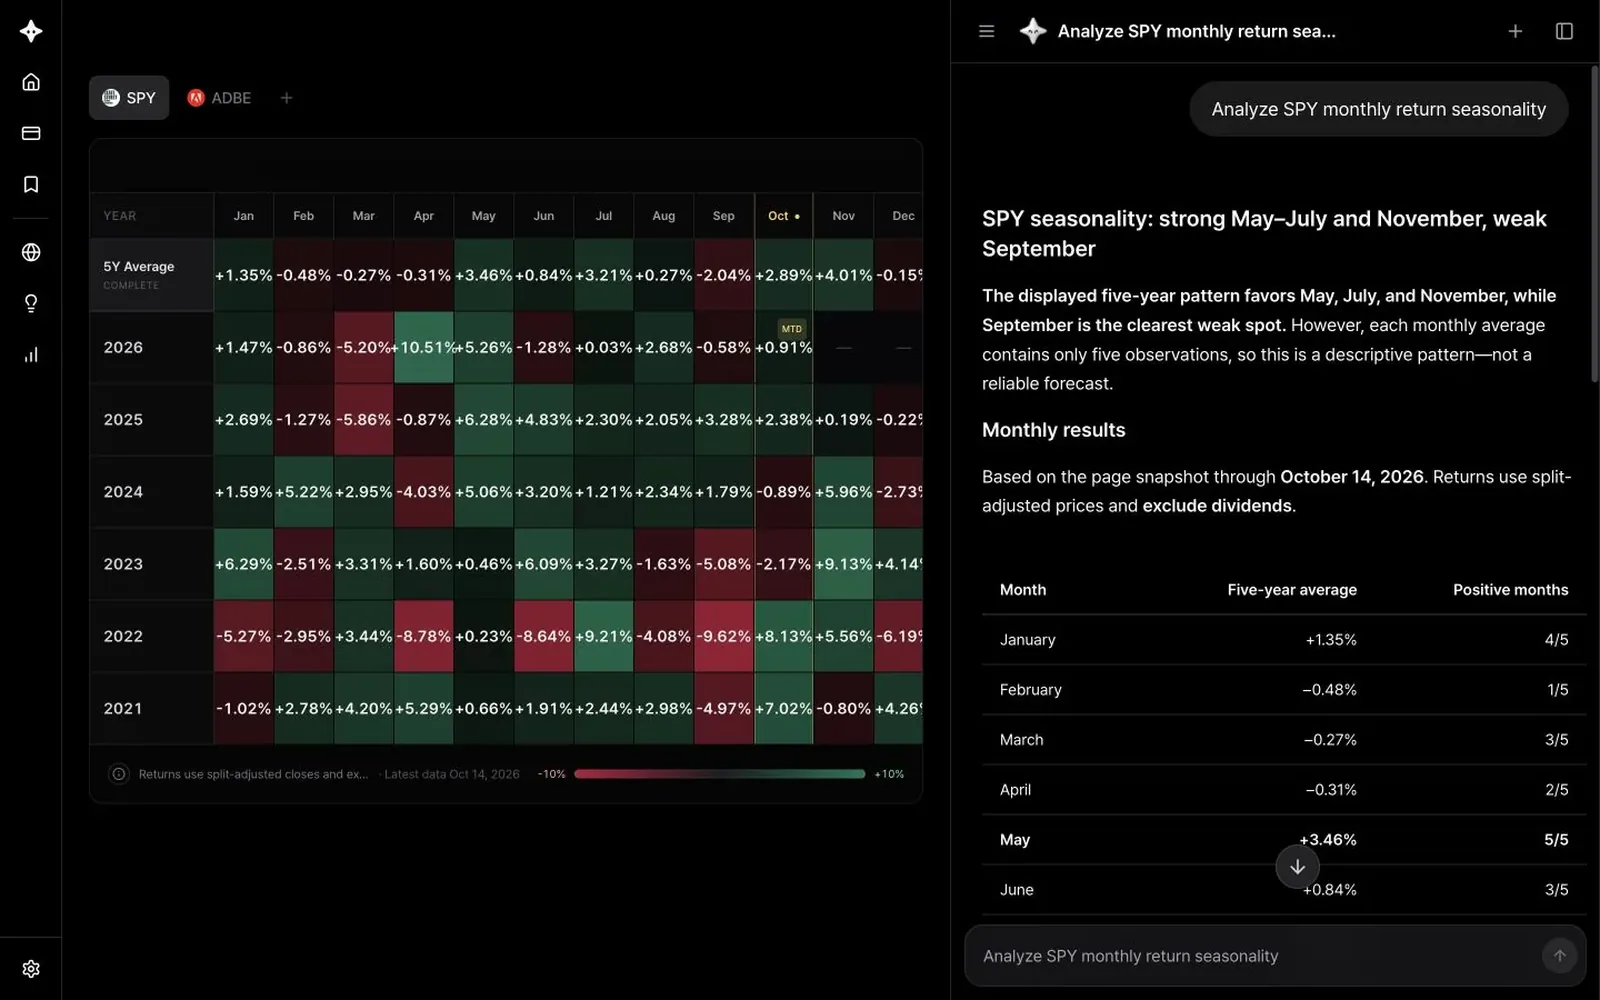
Use AI Research in Monthly Returns
Use AI to read the monthly returns table: the strongest and weakest months, and what the seasonality means.
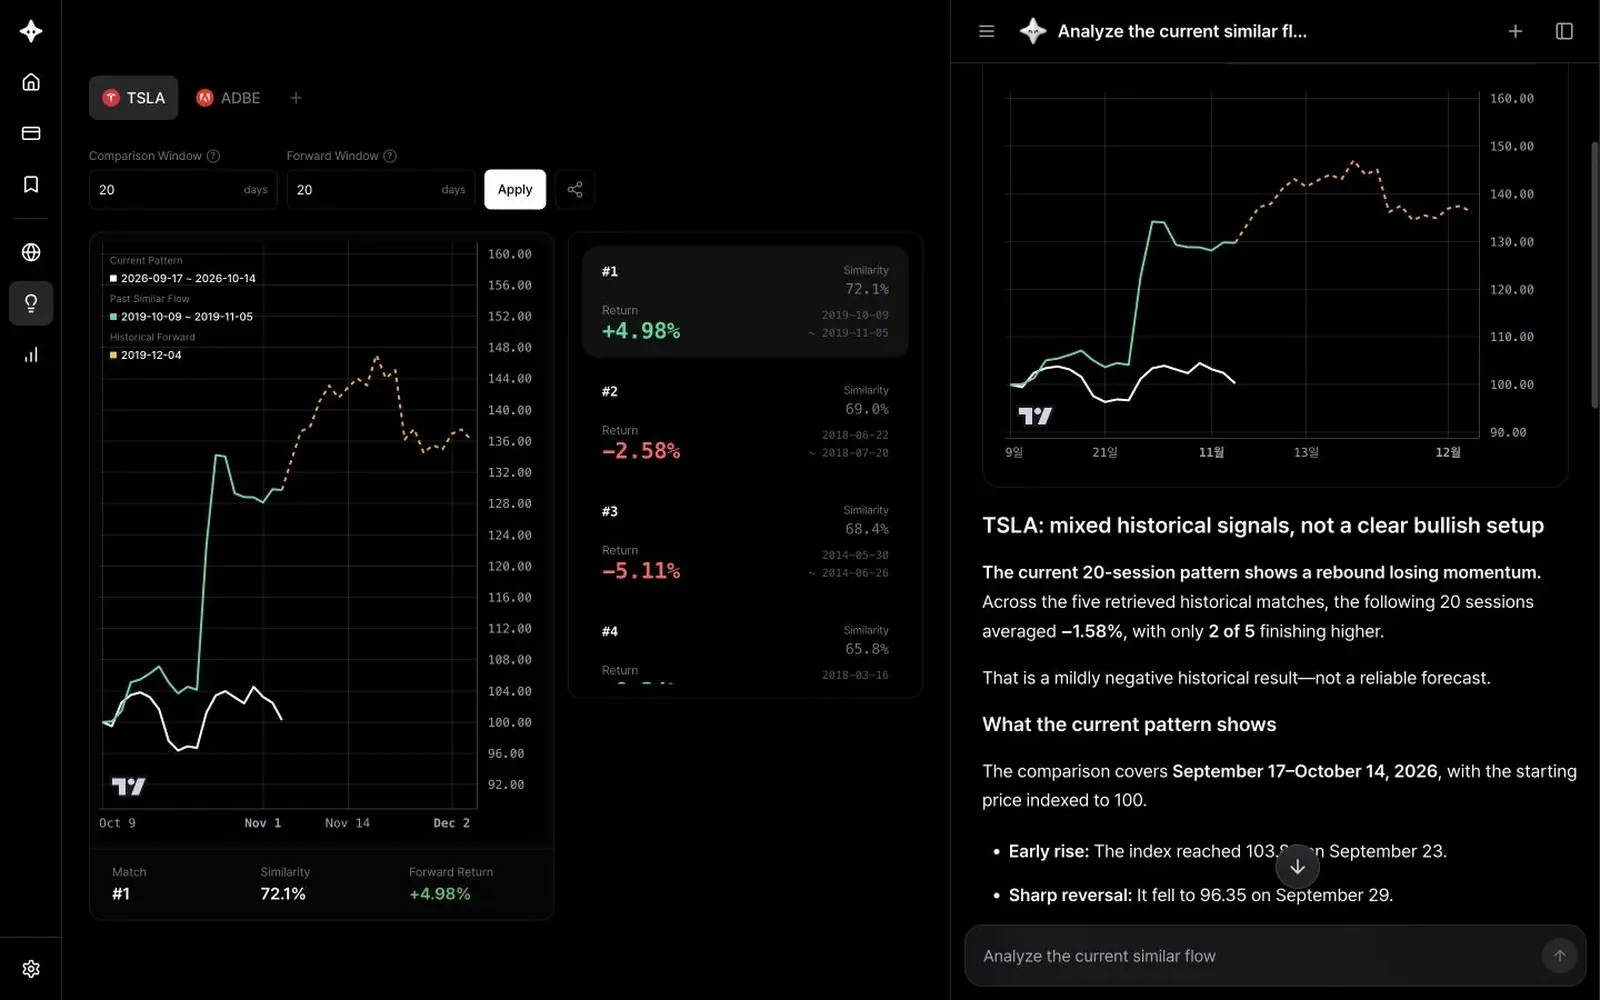
Use AI Research in Past Similar Flow
Use AI to interpret past price patterns that looked like today and what happened afterward.
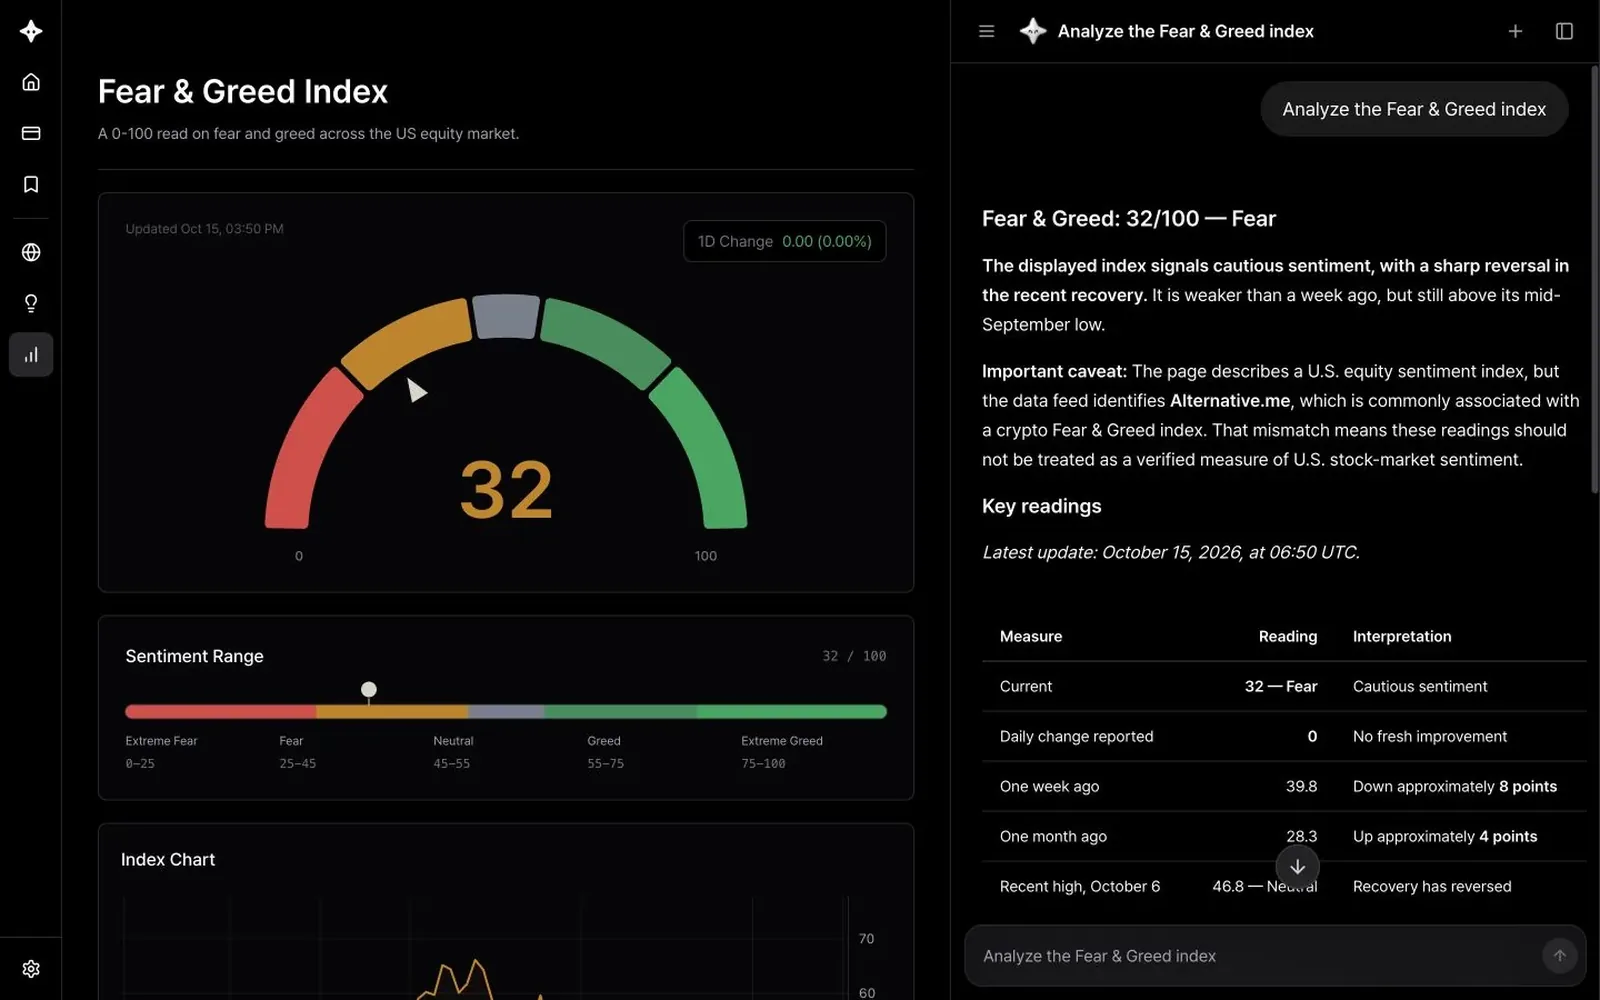
Use AI Research with Market Sentiment Indexes
Use AI to interpret the Fear & Greed Index, VIX, KOSPI Volatility and Fear & Greed vs SPY.
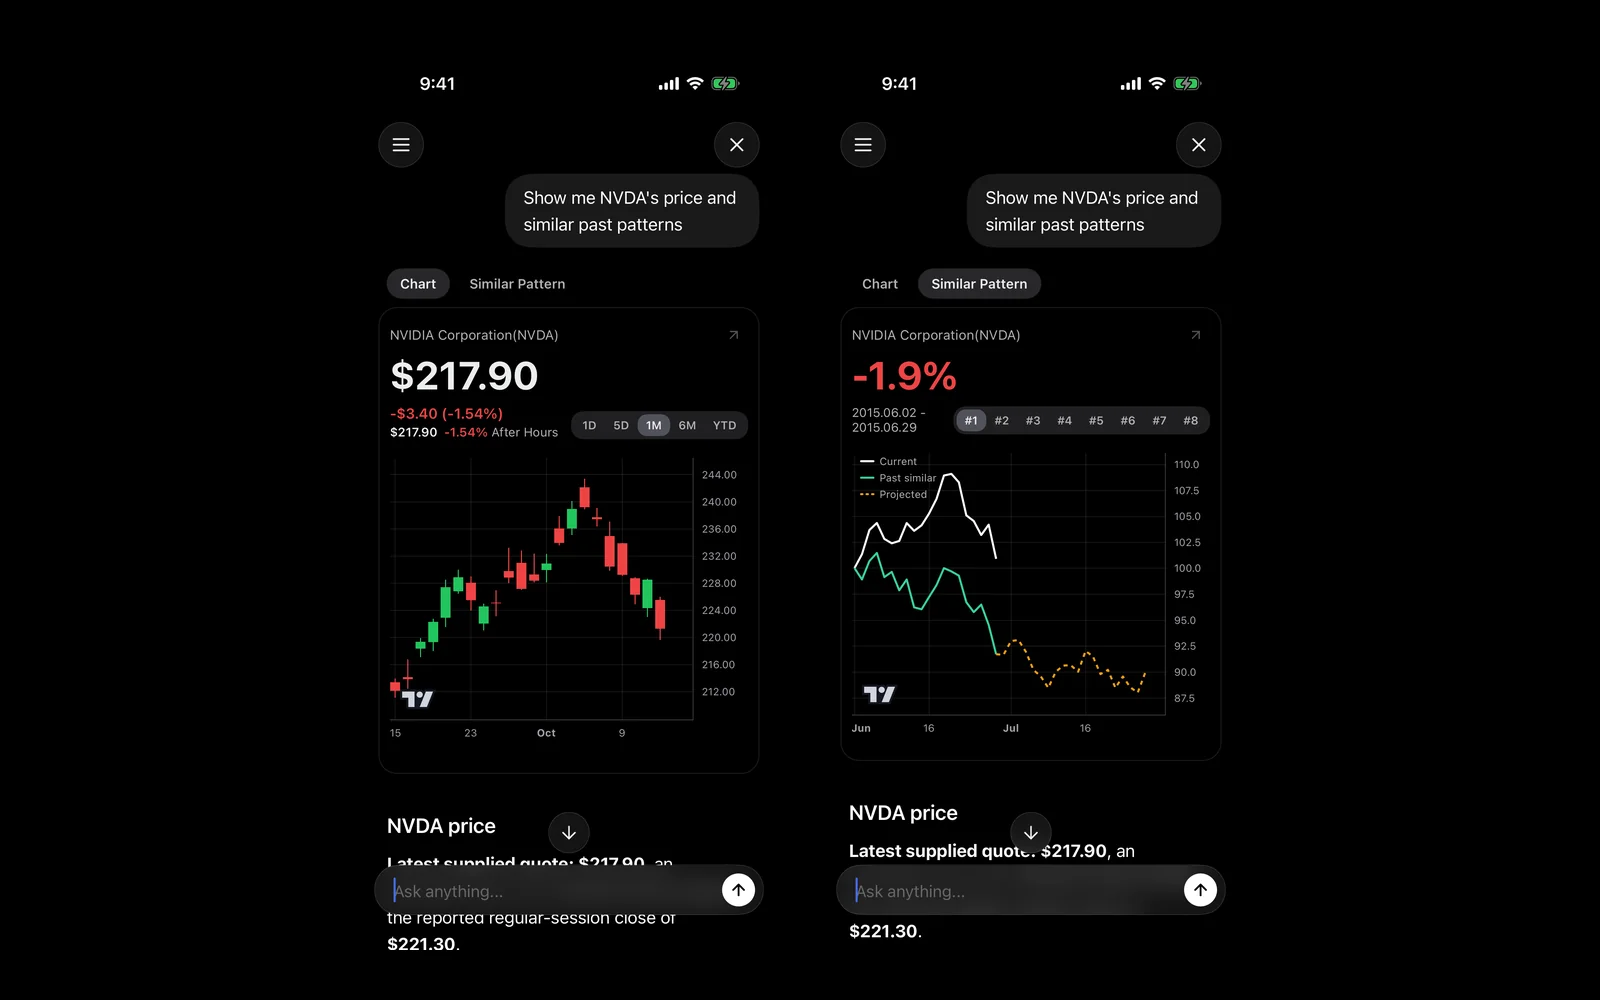
Use AI Research in the Mobile App
Use the AI Research tab in the app, stock and similar pattern cards, and ask straight from news and the calendar.