

Past Similar Flow guide
Guide
Past Similar Flow finds earlier periods in the same stock's history whose daily price moves resemble its most recent window. It answers the question: "Has the stock moved like this before, and what happened next?" It shows up to eight similar periods, ranked by similarity.
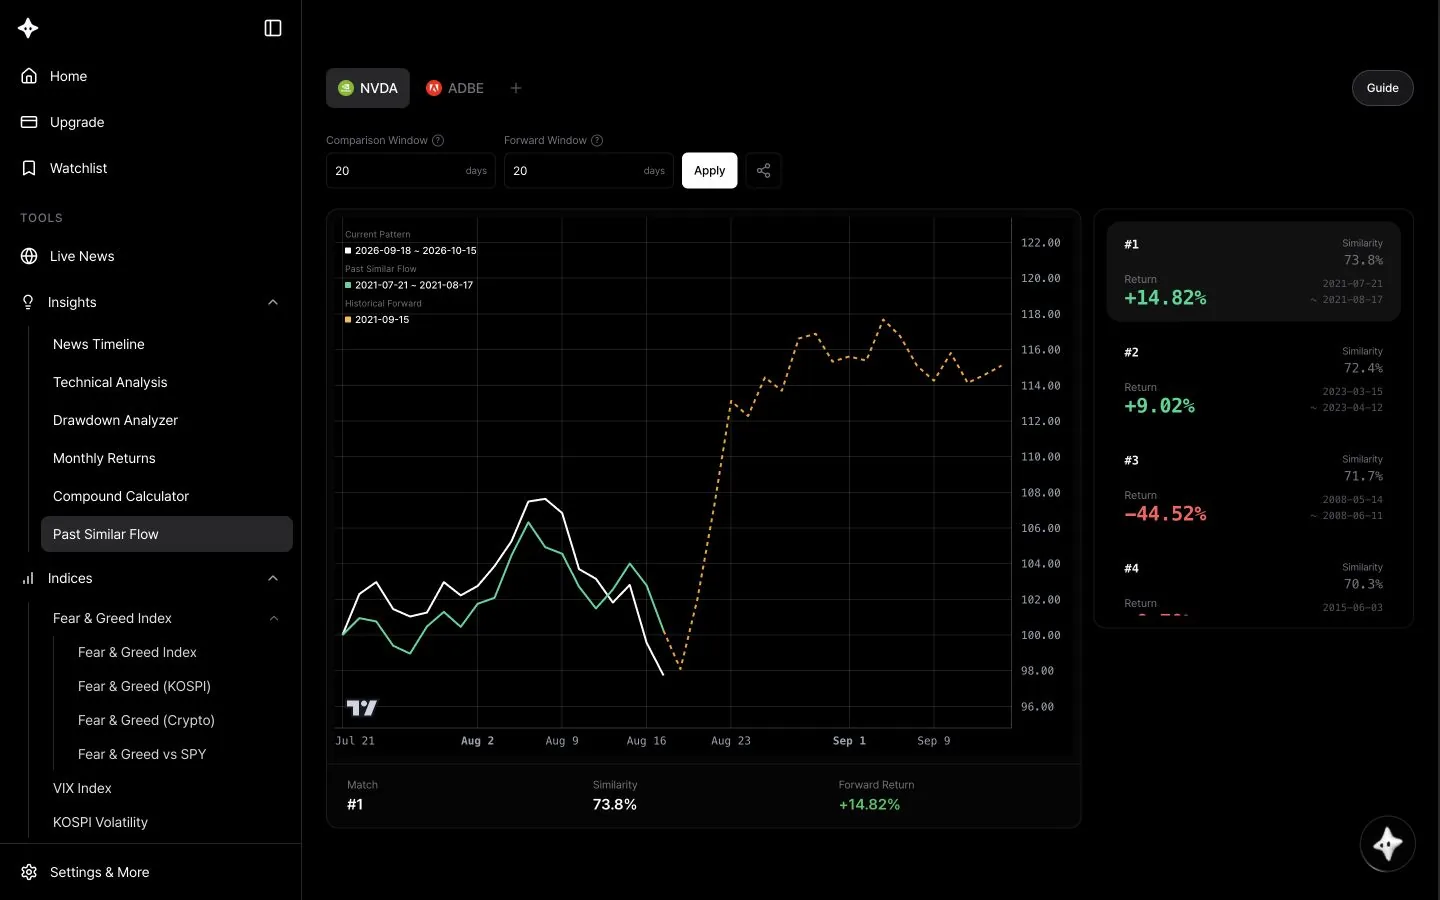
Screen layout
- Symbol tabs and the
+button: Symbol tabs run across the top.+opens a symbol search where you can pick from the Stocks, Commodities, Crypto and Watchlist tabs. The Guide button opens this guide in a new tab. - Comparison Window: how many recent trading days define the current pattern. Default 20, range 5–120 days.
- Forward Window: how many trading days to look ahead after each matched period. Default 20, range 5–120 days.
- Apply and Share: changes to the windows take effect only when you press Apply. Share creates a link to the current symbol, windows and selected match.
- Comparison chart: three overlaid lines. White Current Pattern, green Past Similar Flow and dashed amber Historical Forward, with each range's actual dates in the legend. Below the chart you see the Match rank, Similarity and Forward Return.
- Match list: each entry shows its rank (#1–#8), Similarity, Return and the historical start and end dates. The #1 match is selected first.
How to use it
- Open Past Similar Flow. You need to be logged in.
- Pick a symbol from the tabs, or search with
+. A symbol picked from search can be analyzed right away without saving it to your watchlist. - Enter the Comparison Window and Forward Window, then press Apply.
- Click through the matches to compare the chart and the figures below it.
- Use Share to send the same view to someone else. Recipients also need to log in.
How to read it
- Similarity measures how closely the day-to-day ups and downs of the past period track the recent window. It compares the shape of daily moves, not price levels, and the closer to 100% the more alike. It is not a probability that the price will rise.
- Both lines start at 100 so their shapes can be compared. The white Current Pattern is drawn on the past period's dates, so check the legend for its real dates.
- Forward Return (Return in the list) is the change from the matched period's last close to the close the chosen number of trading days later.
- Only past periods whose full forward window is already known are compared, and matches can partly overlap each other.
- Prices are daily closes, adjusted for stock splits, with dividends not included.
Tips
- Don't rely on the #1 match alone. Check whether the forward returns of all eight matches point the same way or scatter widely.
- Try Comparison Windows like 20 and 60 days to see how short and longer patterns differ.
- A short Forward Window (e.g. 5 days) versus a long one (e.g. 60 days) separates the short-term reaction from the medium-term trend.
- High similarity doesn't mean the market backdrop was the same. Check the news and market mood of that period too.
Use with AI Research
Open AI Research at the bottom right and it interprets the results using the symbol, window settings and selected match you are viewing.
- "Analyze the current similar flow"
- "Explain the difference between the #1 and #2 matches"
- "What news or market conditions were there at that time?"
Learn more about using AI Research with Past Similar Flow
Good to know
- You need to be logged in. There is no limit on the number of scans.
- How far back the comparison goes depends on how much data is available for each symbol. With too little data, or a recent pattern that barely moves, you may see Failed to scan patterns or No Similar Pattern found.
- Past Similar Flow compares the same stock's past price moves for reference only. It does not guarantee the same outcome and is not investment advice.