

Technical Analysis guide
Guide
Technical Analysis lets you add technical indicators such as moving averages, RSI and MACD to a candlestick chart. It helps you answer "What do this stock's trend, momentum, volume and volatility look like together right now?" by letting you pick up to 12 of 38 indicators and compare them on one screen.
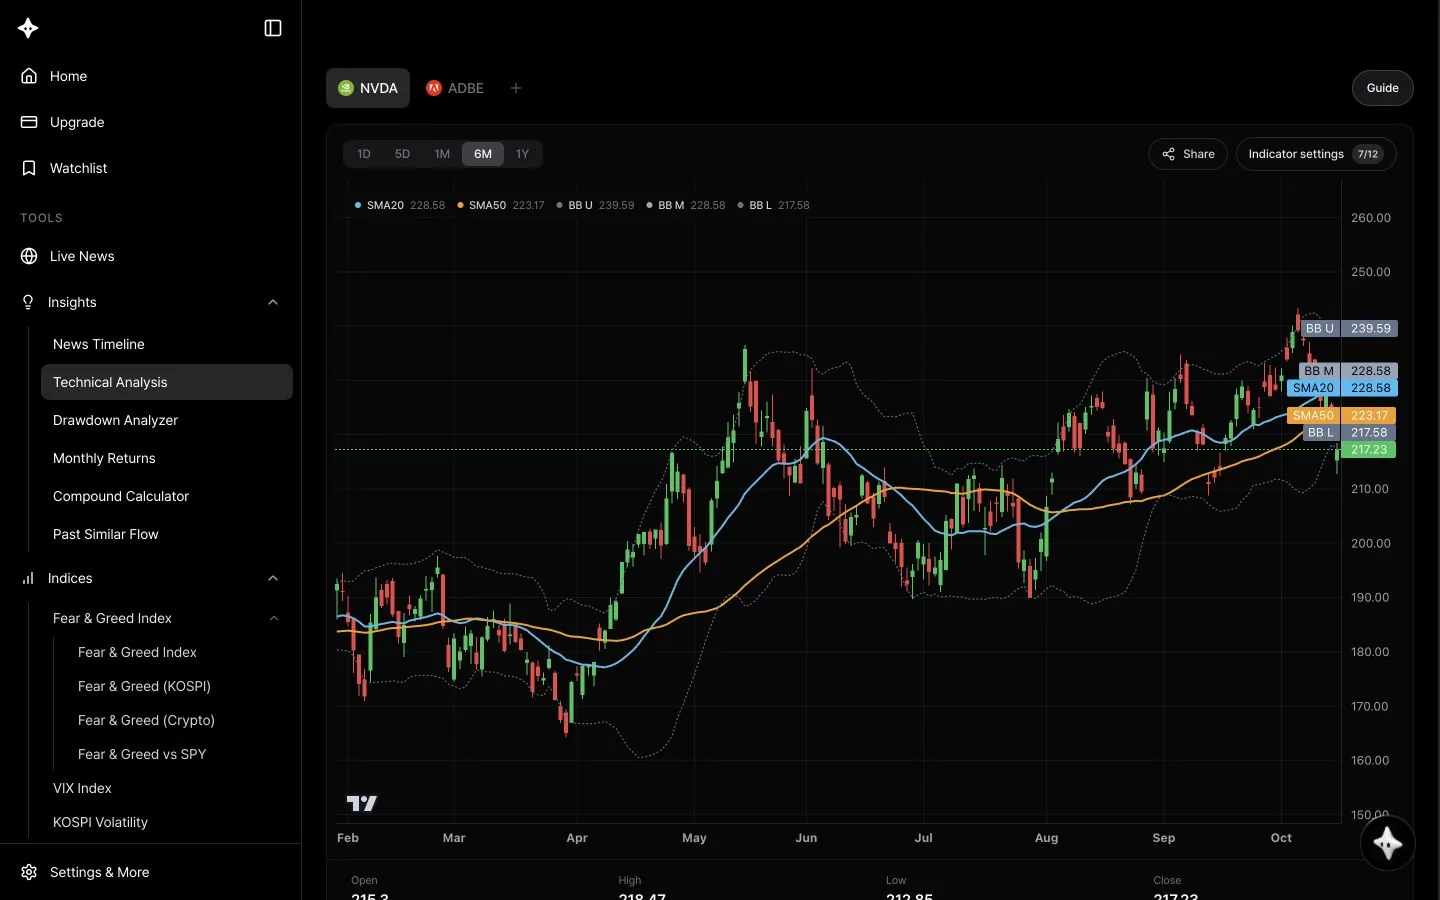
Screen layout
- Stock tabs: your watchlist stocks appear with their logos, and the + button lets you find other stocks. The Guide button on the right opens this guide.
- Period buttons: 1D (15-minute candles), 5D (1-hour candles), and 1M, 6M and 1Y (daily). 6M is the default.
- Share and Indicator settings buttons. The number next to Indicator settings (for example, 7/12) is how many indicators are on.
- Price chart: overlay indicators such as moving averages and Bollinger Bands are drawn on the candles. The legend at the top left shows each indicator's name and latest value (for example, BB U, BB M and BB L are the upper, middle and lower Bollinger Bands).
- Latest candle values below the chart: Open, High, Low and Close.
- Indicator cards: indicators that aren't drawn on the price, such as RSI and MACD, stack below the chart as cards. Each card shows the indicator name, a description and its Latest value.
Seven indicators are on at first: SMA20, SMA50, BBands, RSI, MACD, OBV and ATR.
How to use it
- Pick a stock from the tabs or search with +. You can view stocks that aren't saved to your watchlist.
- Choose the chart range with the period buttons.
- Click Indicator settings to open the list. Type a name in Search indicators to find one.
- Turn indicators on or off with their switches. Changes apply to the chart right away; there's no save button.
- Click Close or outside the window, then check the chart and indicator cards.
- To show the same setup to someone else, click Share. The link includes the stock, period and selected indicators.
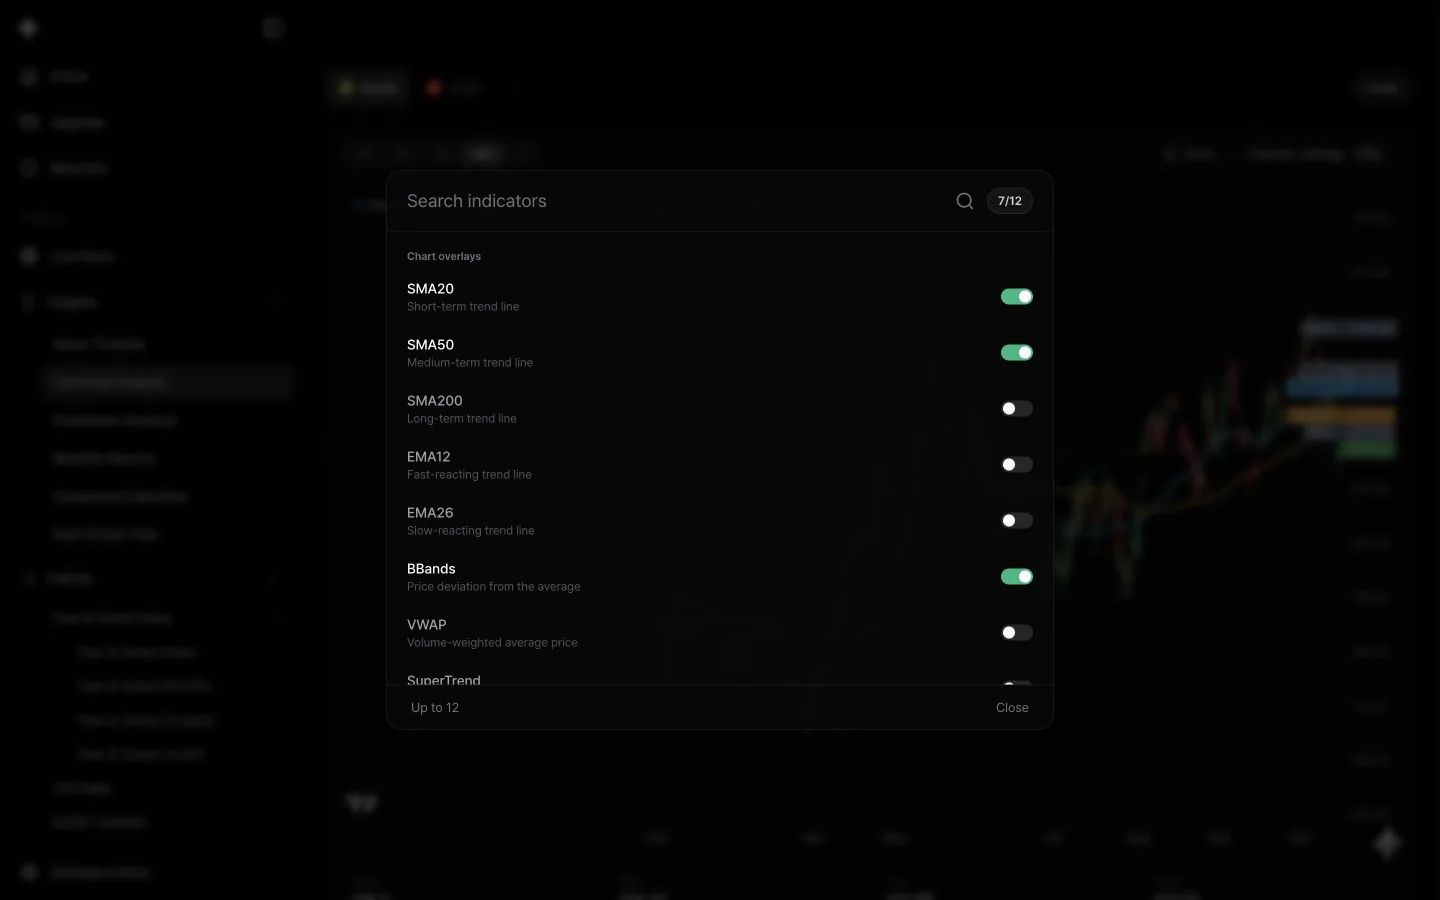
Indicator types
| Category | Indicators |
|---|---|
| Chart overlays (16) | SMA20 (short-term trend), SMA50 (mid-term trend), SMA200 (long-term trend), EMA12, EMA26, BBands (Bollinger Bands), VWAP (volume-weighted average price), SuperTrend, WMA20, DEMA20, KAMA20, TEMA20, TRIMA20, Keltner (ATR-based price channel), Ichimoku (Ichimoku Cloud), SAR (Parabolic SAR) |
| Momentum (15) | RSI (overbought/oversold), MACD (trend changes and momentum), ADX (trend strength), Stoch, CCI, W%R, MFI (volume-weighted RSI), ROC, MOM, Aroon, PPO, StochRSI, %B (position within Bollinger Bands), UltOsc, CMO |
| Volume (4) | OBV (cumulative volume flow), A/D (accumulation/distribution), ADOSC, RVOL (volume versus usual) |
| Volatility (3) | ATR (average range), NATR (volatility relative to price), TRange (true range of the current bar) |
How to read it
- Moving-average periods count bars. SMA20 averages the last 20 bars, so it's 20 trading days on daily candles but about 5 hours on 1D (15-minute candles).
- Legend and card values are for the latest bar. Hovering over another candle doesn't change the legend numbers.
- The price chart can be zoomed and panned; the indicator cards below are fixed.
- Ichimoku is drawn as five lines, Tenkan, Kijun, Span A, Span B and Chikou, without a filled cloud. SAR is drawn as a line rather than dots.
- The RSI card doesn't draw 30/70 guide lines, so judge overbought and oversold levels from the value.
- The MACD card shows the MACD line, signal line and histogram together.
- Indicator settings such as periods are fixed and can't be changed (for example, RSI 14, MACD 12/26/9, Bollinger Bands 20/2).
Tips
- Pick one indicator from each category, such as one trend, one momentum and one volume indicator, for a steadier read than relying on one indicator.
- For the long-term picture, turn on SMA50 and SMA200 on 1Y and check where the two lines sit relative to each other.
- If the price is rising but OBV or A/D isn't, it's worth checking whether volume supports the move.
- Use ATR to see the stock's usual range when setting stop-loss or target distances.
- More indicators make the screen busier, so keep only the ones you need turned on.
Use with AI Research
Open AI Research on this page and it reads the current stock, period, active indicators and latest values, and can turn indicators on or change them on your chart when you ask.
- "Turn on trend indicators and explain the current trend"
- "Based on RSI and MACD, is it overheated right now?"
- "Summarize recent risk using volatility indicators"
Learn more about AI Research for Technical Analysis
Good to know
- Login is required. All 38 indicators are available on every plan.
- You can turn on up to 12 indicators at once. When 12 are on, turn one off before adding another.
- Period buttons use a fixed number of bars, not exact calendar ranges. For example, 1M shows the latest 60 daily candles.
- Candle prices are split-adjusted.
- If an indicator fails to load, its card may show an error or its line may disappear from the chart.
- Technical indicators are reference information calculated from past prices and volume and are not investment advice.