

Compound Calculator & DCA Simulator guide
Guide
Both tools answer "How much could my money grow if I keep investing?", but in different ways. The Compound Calculator assumes a constant return and calculates how your balance grows, or the return you need to reach a target. The DCA Simulator uses real historical prices to show what a starting amount plus recurring purchases of a symbol would be worth today.
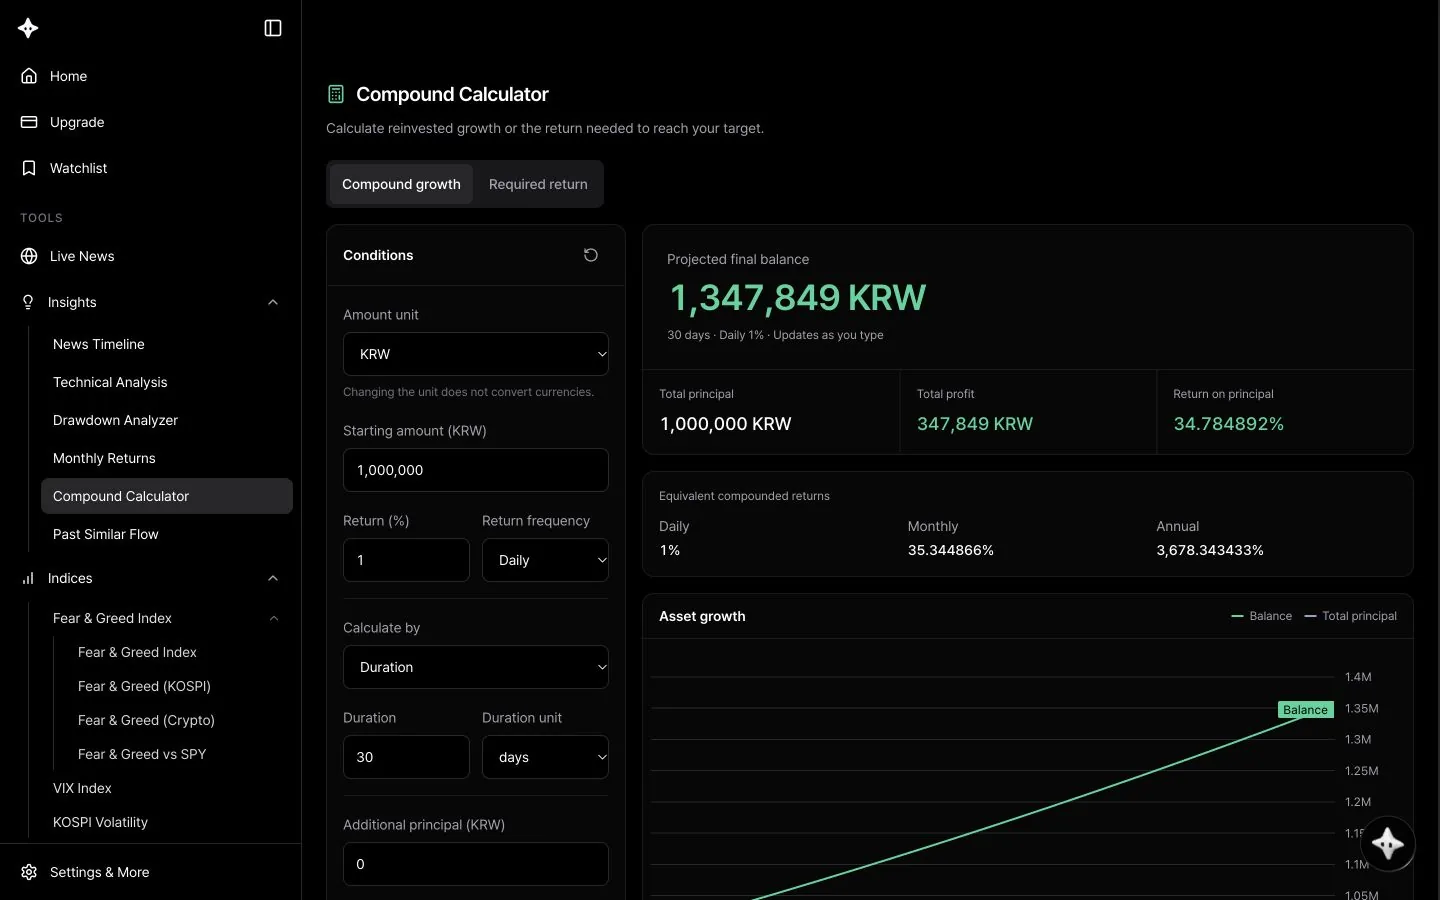
Screen layout
Compound Calculator
- Compound growth (default) and Required return tabs.
- Conditions: Amount unit (KRW, USD, USDT), Starting amount (default 1,000,000), Target amount in target mode (default 2,000,000), Return (%) (default 1) with Return frequency (Daily, Monthly, Annual), Calculate by (Duration or Compound cycles, default 30) with Duration unit (days, months, years), and Additional principal with Deposit frequency. Reset restores the defaults.
- Results: Projected final balance or Return needed to reach your target, plus Total principal, Total profit and Return on principal.
- Equivalent compounded returns: the same growth expressed as daily, monthly and annual rates.
- Asset growth chart (Balance and Total principal) and the Period breakdown table (20 rows per page, Previous and Next).
- Calculation basis: explains the assumptions behind the numbers.
DCA Simulator
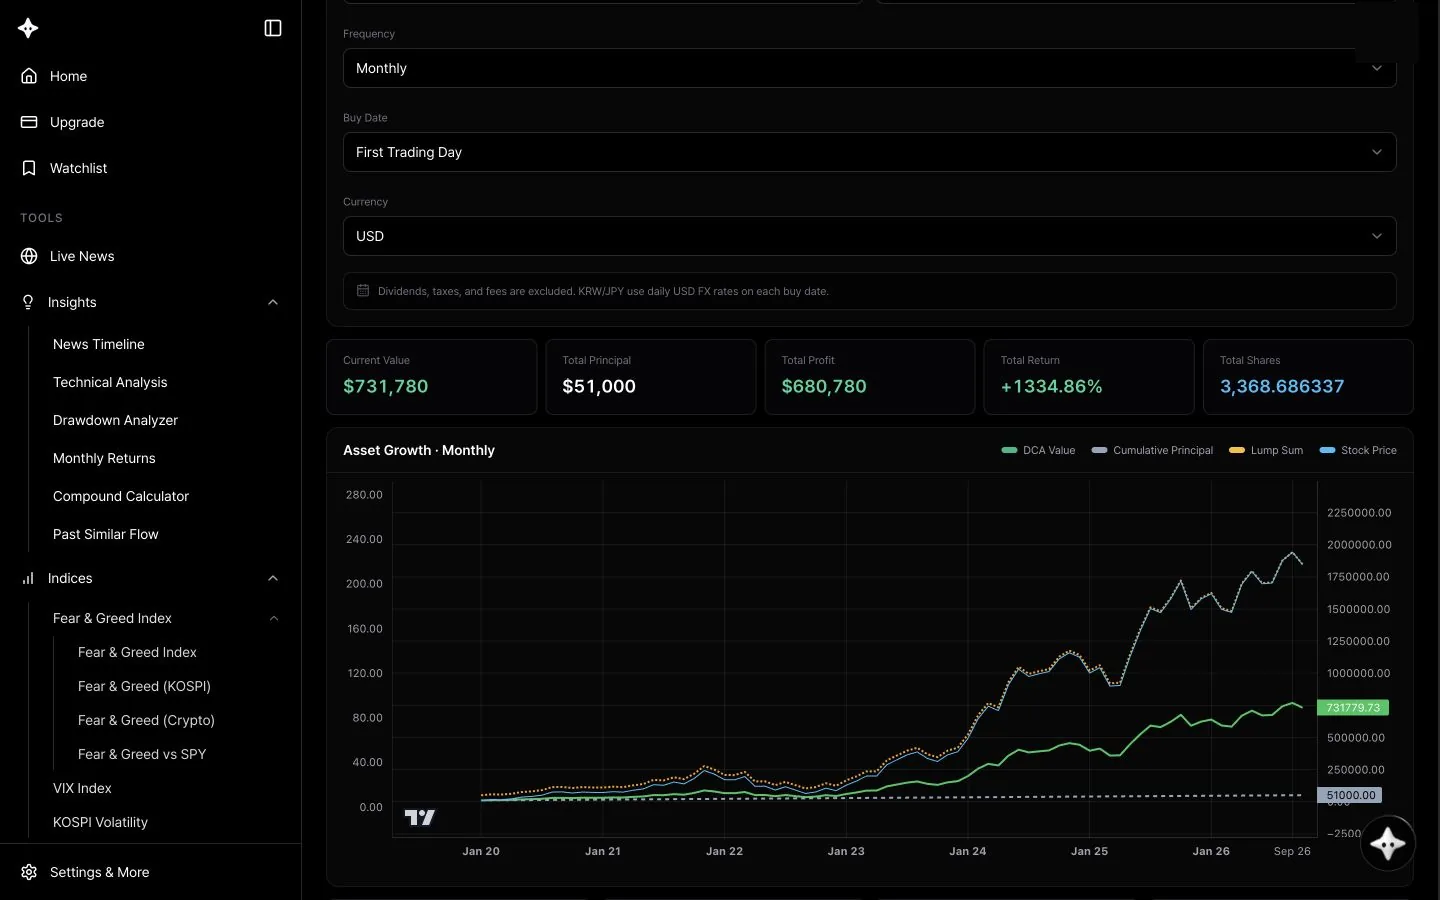
- Symbol tabs and the
+button:+lets you search the Stocks, Commodities, Crypto and Watchlist tabs. You can analyze a symbol without saving it to your watchlist. - DCA Conditions: Start Date (default 2020-01-01), End Date with Until Now (checked by default), Initial Seed (default 10,000), Recurring Amount (default 500), Frequency (Daily, Weekly, Monthly, Quarterly; default Monthly), Buy Date (Period Start, First Trading Day, Last Trading Day; default First Trading Day) and Currency (USD, KRW, JPY). Reset restores the defaults.
- Summary: Current Value, Total Principal, Total Profit, Total Return and Total Shares.
- Asset Growth chart: DCA Value, Cumulative Principal, Lump Sum and Stock Price lines. The daily, weekly, monthly or quarterly spacing is set automatically by the length of the period.
- Comparison metrics: Lump Sum on Day 1, Cash Only, DCA Avg Cost and Current Price.
- Purchase History table (latest 160 buys, newest first) and Yearly Summary table.
How to use it
Compound Calculator
- Open the Compound Calculator. No login is needed.
- Choose a tab and enter the amounts, return, duration and deposits. Results update as you type, with no button to press.
- Check the results, chart and Period breakdown table for the balance at each point.
DCA Simulator
- The DCA Simulator isn't in the sidebar menu, so open it from the DCA Simulator link in this guide or go to
/tools/dca-simulatordirectly. It opens on the first symbol in your watchlist (or AAPL if it's empty), and you need to be logged in. Bookmark it if you use it often. - Pick a symbol and set the period, initial seed, recurring amount, frequency, buy date and currency. It recalculates as soon as you change anything.
- Use the summary and comparison metrics to compare recurring investing, a lump sum on day one and holding cash.
How it's calculated
Compound Calculator
- 1 year = 365 days = 12 months. A month is about 30.42 days, not a calendar or trading month. One compound cycle equals one selected return period.
- Deposits occur at the end of each period, after growth. Enter 0 for no deposits.
- Return on principal = total profit ÷ total principal. It is not an annualized, cash-flow-adjusted return.
- Required return finds the constant return that reaches the target exactly, and the result can be negative.
- Amount unit only changes the label; it does not convert currencies.
DCA Simulator
- Every buy uses that day's closing price and allows fractional shares. Prices are adjusted for stock splits, and dividends are not included.
- First Trading Day and Last Trading Day buy on the first or last trading day of each calendar week, month or quarter. Period Start buys at fixed intervals from your start date. Non-trading days move to a nearby trading day.
- Lump Sum on Day 1 invests the entire total principal on the first trading day. Cash Only holds the same principal with no interest.
- Total Return is total profit ÷ total principal, not an annualized return. Total Return in the Yearly Summary is also cumulative against principal to date, not that year's own return.
- Current Value in Purchase History is today's value of the cumulative shares held after that buy.
- If you choose KRW or JPY, the amounts you enter are treated as that currency and converted at each buy date's USD exchange rate.
Tips
- Use Required return to see what annual return you'd need to hit a target in a given number of years, then ask whether that return is realistic.
- Equivalent compounded returns shows instantly how large "1% a day" becomes over a year.
- In the DCA Simulator, switch between Monthly and Weekly, or First Trading Day and Last Trading Day, to compare how the schedule affects results.
- Pick a period that includes a downturn and compare DCA Avg Cost with Lump Sum on Day 1 to see the effect of buying in installments.
Use with AI Research
These calculators don't send your inputs or results to AI Research. Type the numbers into your question in AI Research instead.
- "Calculate what 10 million won grows to at 8% a year compounded for 20 years"
- "Explain how buying $500 of Apple every month since 2020 would have performed"
- "Compare the pros and cons of recurring investing versus a lump sum"
Learn more in the AI Research guide
Good to know
- The Compound Calculator assumes a constant return and full reinvestment. Fees, taxes, funding, leverage and liquidation are excluded. Amounts can range from 0 to 1 quadrillion, and the total duration can be up to 100 years.
- The DCA Simulator excludes dividends, taxes and fees, and how far back it goes depends on the data available for each symbol. Conditions reset to the defaults when you reload the page.
- Currency conversion in the DCA Simulator treats the symbol's price as US dollars, so results may be inaccurate for symbols not priced in dollars.
- Neither tool's results guarantee actual returns, and they are not investment advice.