

Drawdown Analyzer guide
Guide
Drawdown Analyzer shows how far a stock is below its previous closing high. It helps you answer "How big is the current decline, and how deep did past declines go and how long did they take to recover?" with a drawdown chart and a table of past drawdowns.
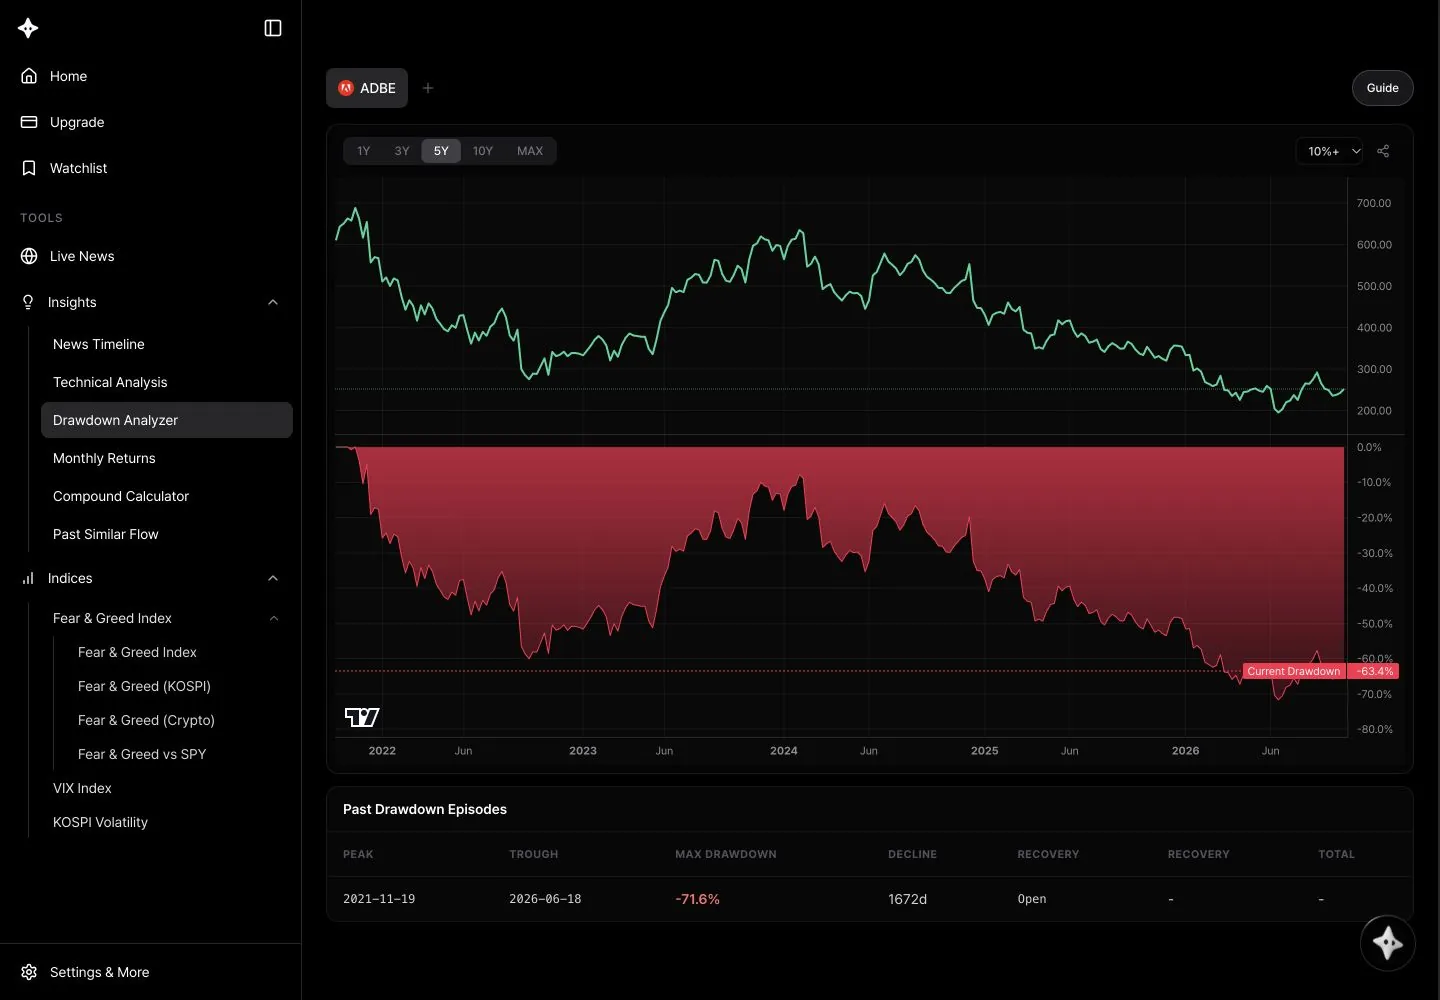
Screen layout
- Stock tabs: your watchlist stocks appear with their logos, and the + button manages your watchlist. The Guide button on the right opens this guide.
- Period buttons: 1Y (daily), 3Y and 5Y (weekly), 10Y and MAX (monthly). 5Y is the default.
- Drawdown Floor menu: choose from 1%+ to 30%+ in 1% steps. 10%+ is the default.
- Share button.
- Chart: the top shows the closing price as a green line, and the bottom shows the Current Drawdown as a red area. Both share a date axis, and you can drag the divider to resize them.
- Past Drawdown Episodes table: Peak, Trough, Max Drawdown, Decline, Recovery (date), Recovery (days) and Total.
How to use it
- Pick a stock from the tabs. Stocks come from your watchlist, so add the stock with + first.
- Choose the range with the period buttons.
- Use Drawdown Floor to set the smallest decline shown in the table. For example, 20%+ lists only declines of 20% or more.
- Check the current drawdown in the lower chart, and use the table to compare how deep past declines went and how long they lasted.
- To share the same setup, click Share. The link includes the stock, period and floor.
How it's calculated
- Drawdown = (current close ÷ highest close up to that point − 1) × 100. 0% means the stock is at its peak; −25% means it's 25% below the peak.
- It uses closing prices, not intraday lows. Prices are split-adjusted and exclude dividends.
- The highest close is tracked from the start of the selected period. An earlier, higher peak before the period isn't included, so changing the period can change the drawdown.
- 3Y and 5Y use each week's last close, and 10Y and MAX use each month's last close. This can skip lows within a week or month, so the max drawdown may look smaller or the dates may shift slightly.
- A drawdown episode starts at a peak and ends on the first close at or above that peak.
- Decline: from the peak to the trough
- Recovery (days): from the trough to the recovery date
- Total: from the peak to the recovery date
- Durations are calendar days, not trading days. An episode that hasn't recovered shows Open in the Recovery date column and
-for the durations. - The table lists up to 20 episodes, deepest first. Drawdown Floor filters only the table; the chart doesn't change.
Tips
- Compare the current drawdown with the largest past ones to judge whether this pullback is normal or unusual for the stock.
- Raise Drawdown Floor to 20% or 30% to keep only big declines and see how long deep drawdowns usually took to recover.
- Before buying, look at the largest past drawdown and ask whether you could hold through a loss that size.
- Compare several stocks with the same period and floor to see which fall harder and stay down longer. Adding an index ETF such as SPY to your watchlist gives you a benchmark.
Use with AI Research
Open AI Research on this page and it interprets the current situation using the current drawdown and the largest past episodes.
- "How does the current drawdown compare with past ones?"
- "What caused the three biggest drawdowns, and how long did each take to recover?"
- "Are there any drawdowns that haven't recovered yet?"
Learn more about AI Research for Drawdown Analyzer
Good to know
- Login is required.
- If your watchlist has stocks, you can only pick from them. Choosing a stock that isn't in your watchlist switches back to the first watchlist stock.
- MAX covers the full range of available price data, which may not reach back to the stock's listing date.
- Dates are the trading dates from the price data and aren't converted to Korea time (KST).
- Past declines and recovery times describe historical data and don't guarantee future recoveries. This is not investment advice.