

Fear & Greed vs SPY guide
Guide
Fear & Greed vs SPY puts the US Fear & Greed Index side by side with SPY, the S&P 500 ETF, over history. It answers questions like "How did SPY move after periods of extreme fear?" and "When did sentiment last move like it does now?" It is a historical comparison, not a backtest that runs a buy-and-sell strategy.
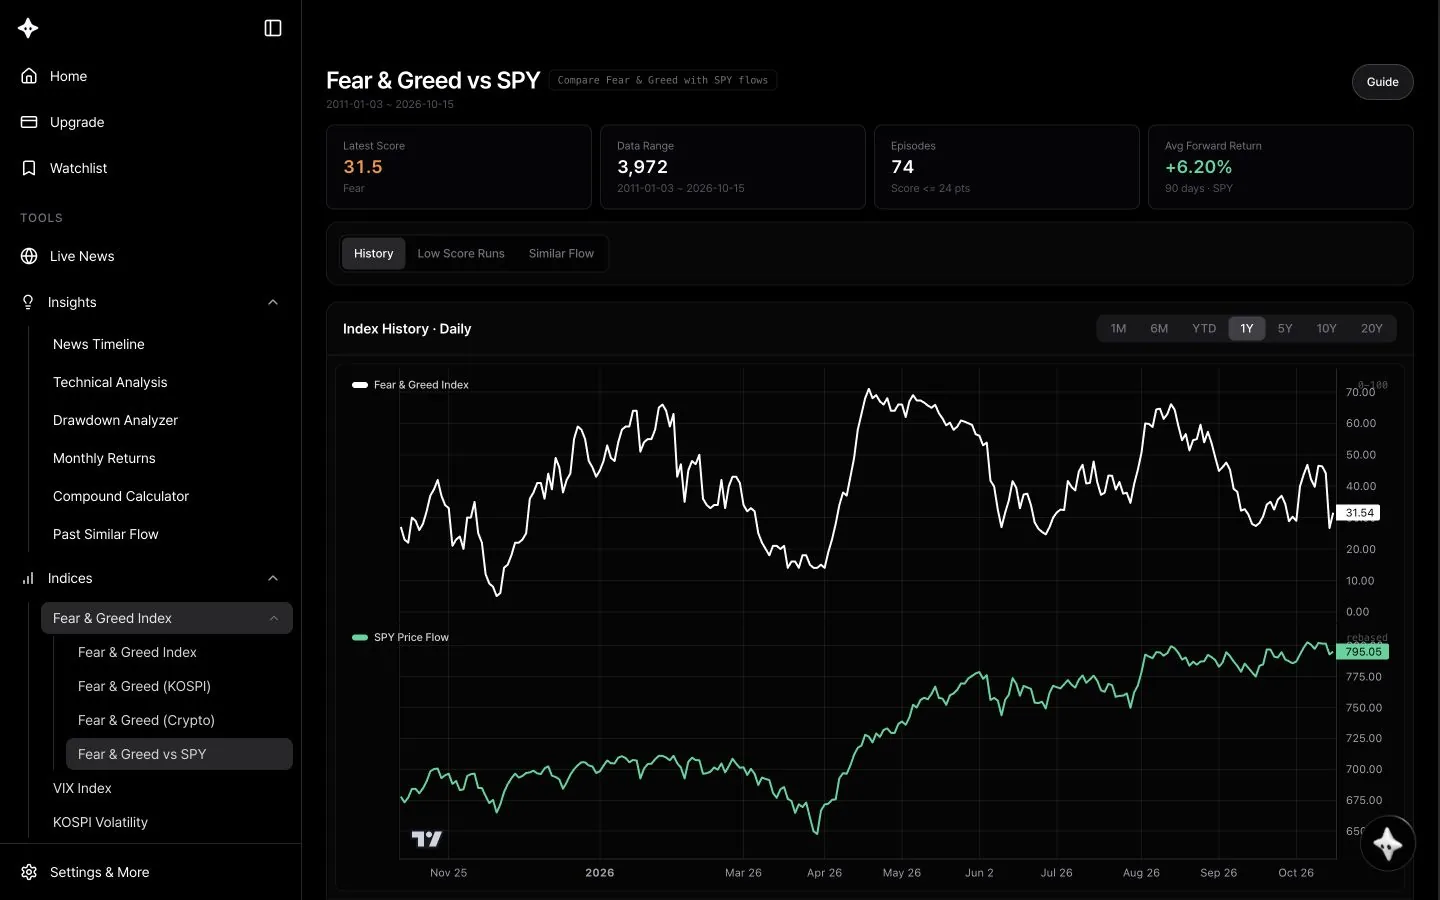
Screen layout
- Title and data range: the full date range loaded appears next to the Fear & Greed vs SPY title, and the Guide button opens this guide in a new tab.
- Four summary metrics: Latest Score with its sentiment label, Data Range, Episodes and Avg Forward Return. The last two always reflect the Low Score Runs analysis, whichever tab you're on.
- Mode buttons: History (default), Low Score Runs and Similar Flow.
- History: the Index History chart shows the Fear & Greed Index (0-100) on top and SPY Price Flow below on a shared time axis. Period buttons are 1M, 6M, YTD, 1Y (default), 5Y, 10Y and 20Y. Below the chart are Latest Score, Range and Avg Score.
- Low Score Runs: set Fear Level (default 24), Recovery Level (default 45) and Forward Window (default 90 days), then Apply. The Selected Run Flow chart shows Min Score, Recovery and SPY Return, and the side list shows Positive Rate, Avg Recovery and the episodes, newest first.
- Similar Flow: set Comparison Window (default 30 days) and Forward Window (default 90 days), then Apply. The Similar Flow Comparison chart draws Current FNG, Historical FNG, Forward FNG and SPY Forward, and you can pick from up to eight ranked matches.
Each setting has a ? tooltip, and Reset returns the numeric settings to their defaults.
How to use it
- Open Fear & Greed vs SPY. You need to be logged in.
- In History, switch periods to see the broad flow of Fear & Greed and SPY together.
- Go to Low Score Runs, enter Fear Level, Recovery Level and Forward Window, and press Apply. Recovery Level must be higher than Fear Level.
- Click an episode in the list to see how the index and SPY moved at the time.
- In Similar Flow, set the Comparison Window, press Apply and click through the ranked matches.
How to read it
- A low-score episode is a run of consecutive readings at or below the Fear Level. Recovery is the number of days from the start of the episode until the score first rises to the Recovery Level or higher. If it hasn't recovered yet, it shows N/A.
- SPY Return runs from SPY's close on the first day the score fell to the Fear Level to the end of the Forward Window. It starts from that entry day, not from the lowest score or the recovery day. Recent episodes may not yet have a full forward window.
- Positive Rate is the share of episodes with a return above zero. Avg Recovery averages only the episodes that recovered.
- In Similar Flow, Similarity measures how closely the day-to-day changes in recent Fear & Greed readings match a past period. It doesn't mean the score levels are the same, and it isn't a probability of gains.
- In History, SPY is rebased so the first day of the full dataset equals 100. Choosing a shorter period does not rebase it again.
- SPY uses daily closes adjusted for splits, dividends and similar events. Day counts refer to days with Fear & Greed data.
Tips
- Try a Fear Level of 24 and then 15 to see how SPY's path differs when fear runs deeper.
- Set the Forward Window to 20, 90 and 252 days to separate a short-term bounce from the trend over roughly a year.
- Don't stop at the averages. Click on episodes with poor returns too, since some periods of fear lasted a long time before recovering.
- Use Similar Flow as a starting point for finding past periods that resemble today's sentiment, then check the news and economic backdrop of those periods.
Use with AI Research
Open AI Research at the bottom right and it interprets the results using your current mode and settings.
- "Compare the Fear & Greed Index with SPY"
- "Explain the results at my current threshold in simple terms"
- "How would the results change if I changed the threshold?"
Learn more about using AI Research with Fear & Greed vs SPY
Good to know
- You need to be logged in, and the comparison asset is always SPY. There is no limit on the number of analyses.
- Long periods such as 20Y only cover as much data as is available.
- This is a historical comparison that excludes fees, taxes and investment amounts. Past results do not guarantee future returns and are not investment advice.