

Monthly Returns guide
Guide
Monthly Returns shows a stock's returns by year and month as a color-coded table (heatmap). It helps you answer "In which months has this stock tended to rise or fall, and how does this month compare with recent years?" by showing monthly returns alongside a five-year average.
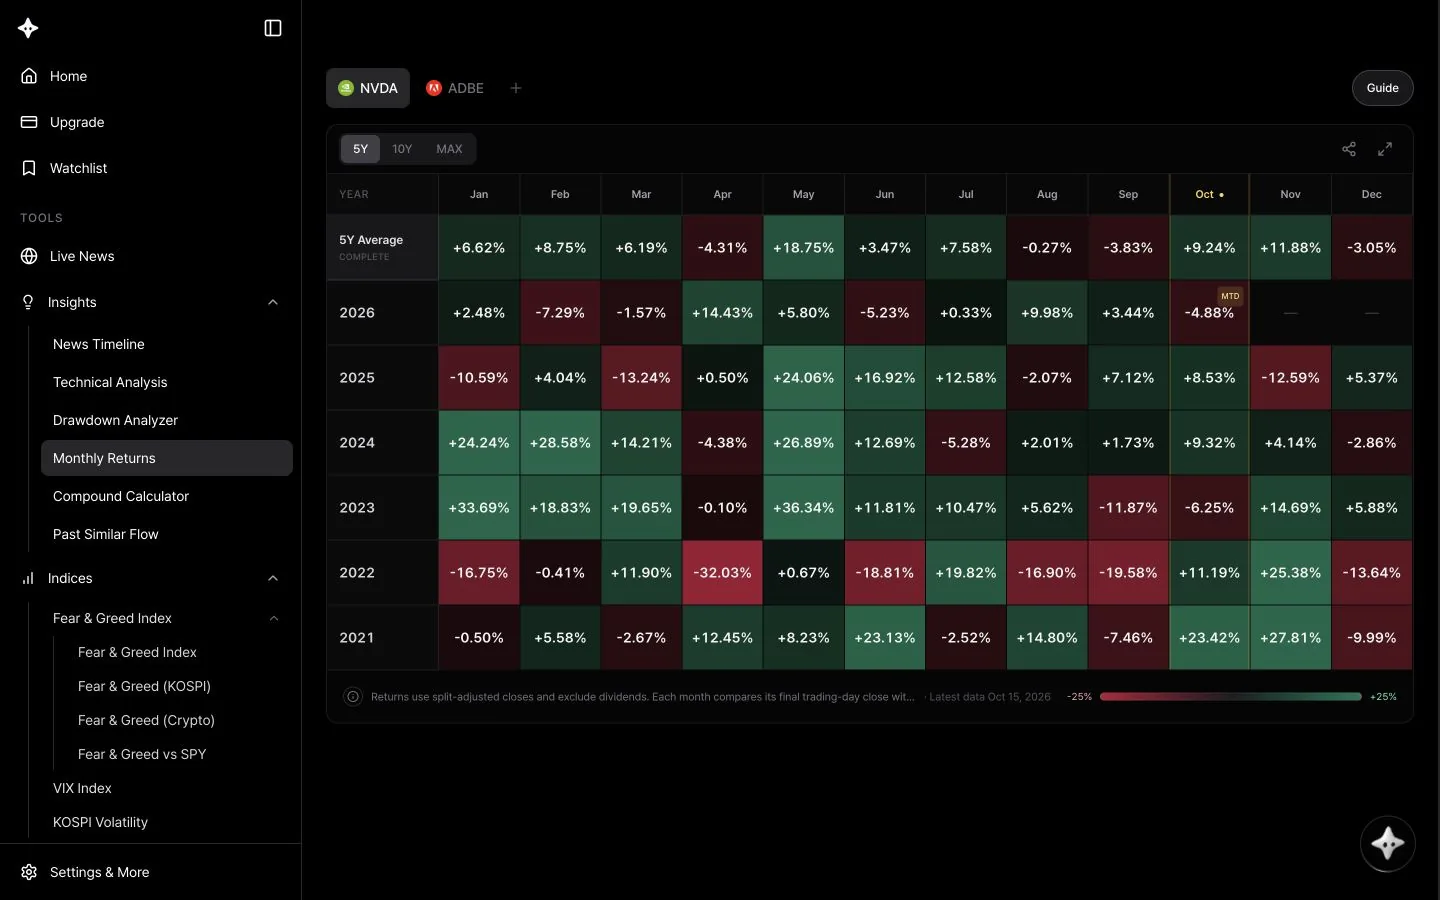
Screen layout
- Stock tabs: your watchlist stocks appear with their logos, and the + button lets you find other stocks. The Guide button on the right opens this guide.
- Period buttons: 5Y (default), 10Y and MAX. On the right are the Share and Enter fullscreen buttons (fullscreen appears only in browsers that support it).
- Heatmap: the first column is Year, followed by Jan through Dec. The top row is 5Y Average (Complete), and the rows below go from the newest year down.
- Each cell shows that month's return to two decimal places (for example, +1.23%).
- Gains are green, losses red and 0% gray, with stronger colors for bigger moves. Cells without data show
—. - The current month's column is highlighted in amber, and a month that isn't over yet carries an MTD badge.
- Footer: a note on how returns are calculated, the Latest data date (on wide screens) and a color range legend.
How to use it
- Pick a stock from the tabs or search with +. You can view stocks that aren't saved to your watchlist.
- Choose 5Y, 10Y or MAX.
- Hover over a cell for details.
- Month cells: the year and month, Complete or MTD, the return and the Period (the two dates compared)
- 5Y Average cells: the return and Observations (for example, 5/5)
- If the table feels small, use Enter fullscreen to enlarge it. To share the same view, click Share.
How it's calculated
- Monthly return = (the month's last trading-day close ÷ the previous month's last trading-day close − 1) × 100.
- Prices are split-adjusted and exclude dividends. It's not a total return including dividends, fees or taxes.
- 5Y Average is the simple average of the five most recent completed returns for that month. It isn't compounded, and the current month (MTD) is excluded. If there isn't enough data, it uses fewer than five values; check Observations in the tooltip.
- 5Y Average is calculated the same way regardless of the selected period (5Y, 10Y or MAX).
- 5Y shows this year plus the previous five, so up to six years appear. 10Y works the same way, with up to eleven years.
- Color intensity scales to the values on screen, so the same number can change color when you switch periods. The printed numbers are always the actual values.
Tips
- Find the darkest green or red months in the 5Y Average row, then check the yearly cells below to see whether the pattern held every year or came from one or two outliers. A high average can come from a single big year.
- Compare the current month's MTD value (the amber column) with the same month in past years to see whether this year is unusual.
- Switch to 10Y or MAX to see whether a pattern is recent or long-standing.
- Compare with the monthly returns of an index ETF such as SPY to tell whether a pattern is specific to the stock or reflects the whole market.
Use with AI Research
Open AI Research on this page and it reads the current stock, period and monthly returns table to sum up which months were strong or weak.
- "Which months were strong and which were weak for this stock?"
- "Compare this month's return with the same month in past years"
- "Check whether the months with a high 5-year average were consistent every year"
Learn more about AI Research for Monthly Returns
Good to know
- Login is required.
- MAX covers the full range of available price data, which may not reach back to the stock's listing date. The first month of data has no previous month to compare with, so it shows no return.
- The current month and completed months follow the UTC calendar, and dates aren't converted to Korea time (KST). Around the start of a month, this can differ from your local date by a day.
- On mobile, swipe the table sideways; the year column stays in place. Depending on your browser, tooltips may not open on tap.
- Past monthly patterns aren't guaranteed to repeat. This is reference information, not investment advice.