

News Timeline guide
Guide
News Timeline shows a candlestick chart alongside related news. It helps you answer "What news came out when this candle moved so much?" by collecting the stock's news from the period of any candle you click.
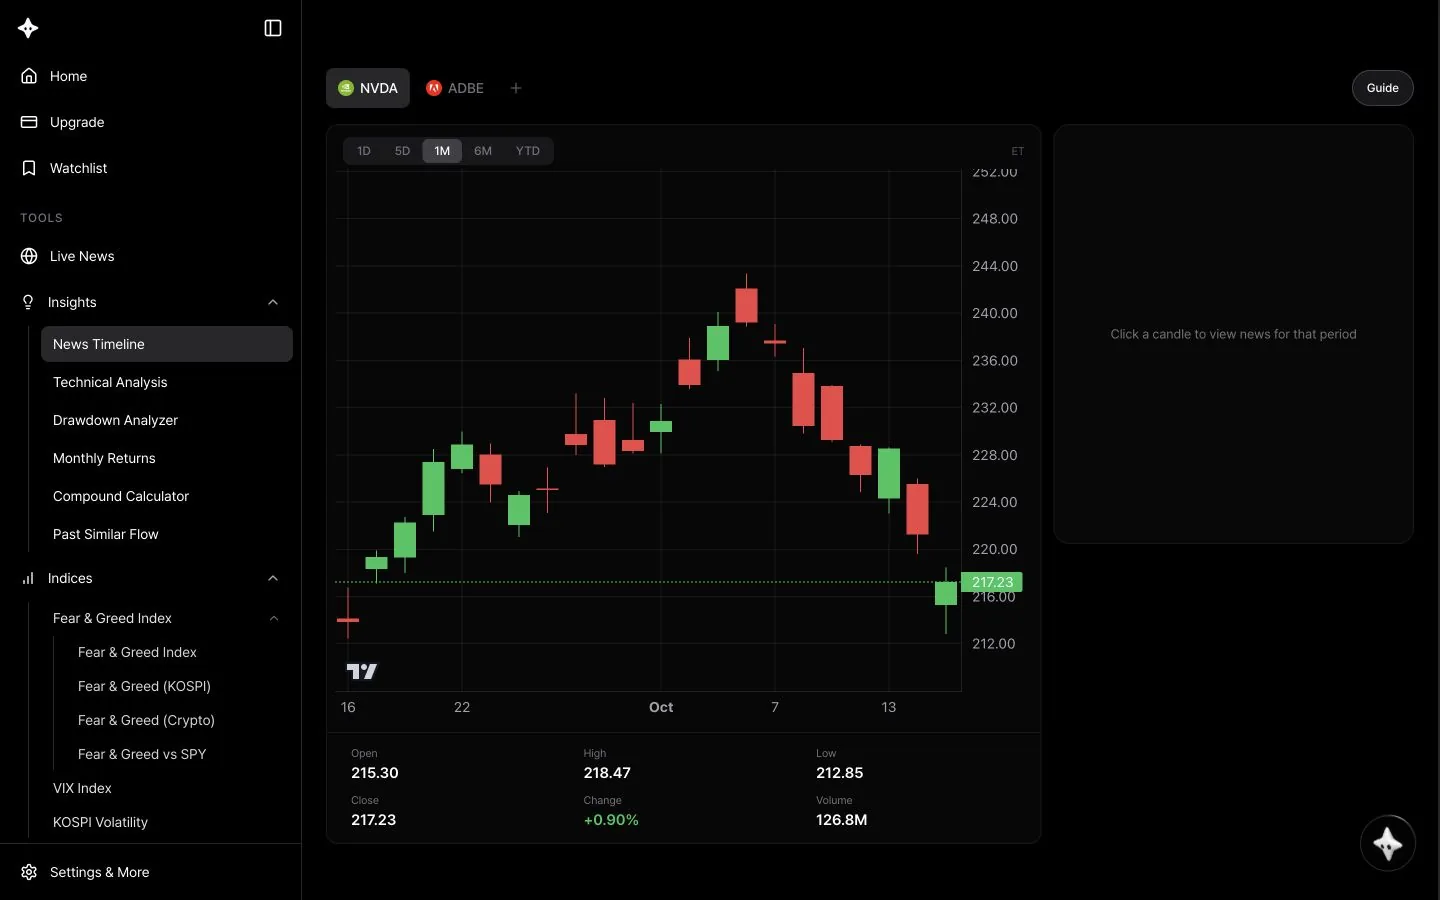
Screen layout
- Stock tabs: your watchlist stocks appear with their logos, and the + button lets you find other stocks. The Guide button on the right opens this guide.
- Period buttons: 1D (15-minute candles), 5D (1-hour candles), 1M (daily, default), 6M (daily) and YTD (year to date, daily). The time basis appears on the right (Pre/Post · ET for intraday candles, ET for daily).
- Candlestick chart: green for up, red for down. Hover over a candle to see its details below.
- Candle details: Open, High, Low, Close, Change and Volume.
- News panel: at first it shows "Click a candle to view news for that period." Once you select a candle, the selected date and time appear at the top, followed by news from that period.
How to use it
- Pick a stock from the tabs or search with +. You can view stocks that aren't saved to your watchlist.
- Choose a range with the period buttons.
- Click a candle that rose or fell sharply. The details below lock to that candle, and its news appears on the right.
- Click a story to open its menu. Stories with a summary show News Summary, headline-only stories show AI Research, and you can also choose Original News or Share.
- Click another candle to switch to its news. Changing the period or stock clears the selection.
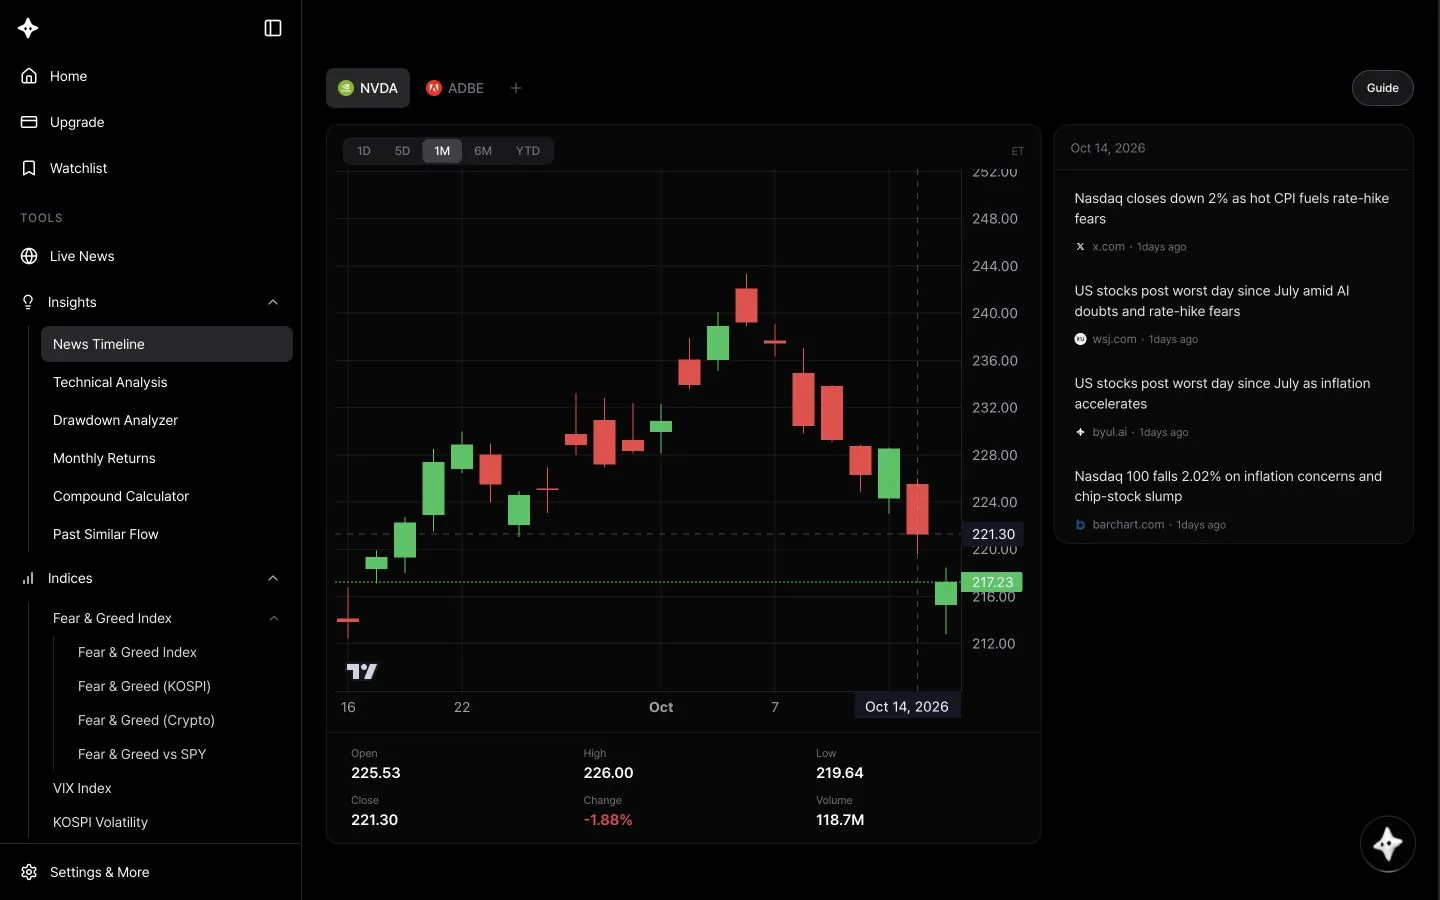
How to read it
- Change is the move from that candle's open to its close. It isn't the change from the previous close, so it can differ from the daily change shown elsewhere.
- Volume is abbreviated with K, M and B.
- News for a daily candle covers that day in US Eastern Time. For 15-minute and 1-hour candles, it covers that candle's time window.
- The news panel takes up to the 20 most recent related stories from the period and sorts them by importance. It doesn't show every story from that period.
- Before you select a candle, the details show the candle you're hovering over, or the latest candle if you aren't hovering.
Tips
- Start with the candles that jumped or dropped the most to quickly find the news that moved the stock.
- On days with big events such as earnings, switch to 1D or 5D to see what time the news came out.
- Candles with unusually high volume are worth checking against the news.
- Compare the positive/negative verdict in the news summary with the candle's direction to gauge how the market took the news.
- News summaries open on this page without using credits.
Use with AI Research
Open AI Research with a candle selected and ask why the price moved during that period, based on the selected candle's prices and time range.
- "Why did the stock move during this candle?"
- "Which news in this period had the biggest impact on the price?"
- "Was this drop caused by a temporary negative story?"
Learn more about AI Research for News Timeline
Good to know
- Login is required.
- Prices are split-adjusted. The chart doesn't support zooming or panning; use the period buttons to change the range.
- Period names are approximate. For example, YTD estimates the number of trading days since the start of the year, so it may not start exactly on January 1.
- The period buttons say pre/post-market is included, but extended-hours trading may not be included for every stock or period.
- "No related news for this date" also appears when news fails to load. It doesn't always mean there was no news, so try clicking the candle again later.
- A stock may have a working chart but no related news.
- The relationship between news and price moves is for reference only and is not investment advice.