

Use AI Research in Past Similar Flow
Guide
Past Similar Flow finds past periods that moved like the stock's recent price action and shows what happened afterward. Open AI Research and it interprets the results using the similarity and subsequent returns of the period you selected.
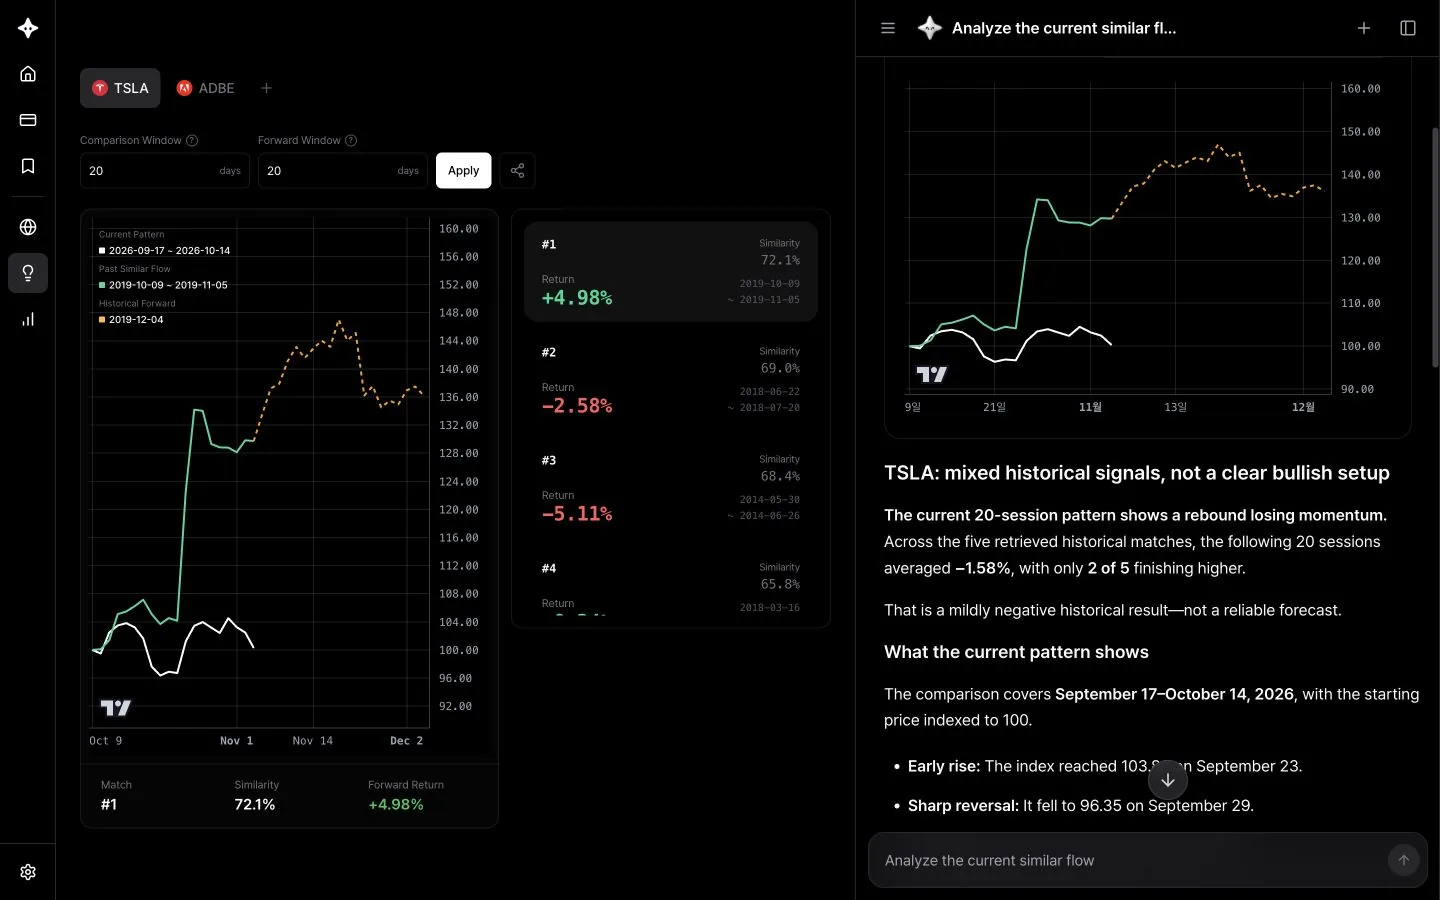
How to use it
- In Past Similar Flow, set the stock, comparison period and follow-up period. Stocks come from your watchlist, so add the stock you want to analyze to your watchlist first.
- Select the similar period you want to look at.
- Open the panel with the AI Research button at the bottom right and ask your question.
Questions to try
- "Analyze the current similar flow"
- "What happened after the most similar past period?"
- "How should I read it when the similar periods had different returns afterward?"
- "What news or market conditions were there back then?"
- "Explain the difference between the #1 and #2 periods"
- "How do I read the similarity score?"
Find patterns right in the chat
Even outside the tool page, ask something like "Find past patterns similar to Tesla's last 60 days and what happened over the next 20 days" and a similar pattern card appears in the answer. You can set the comparison and follow-up periods from 5 to 120 days, and on the web, clicking the card opens this tool.
Good to know
Past Similar Flow compares a stock's own past price moves. A similar shape doesn't mean the same outcome will repeat, so also ask how conditions back then differ from today.