

Use AI Research in Drawdown Analyzer
Guide
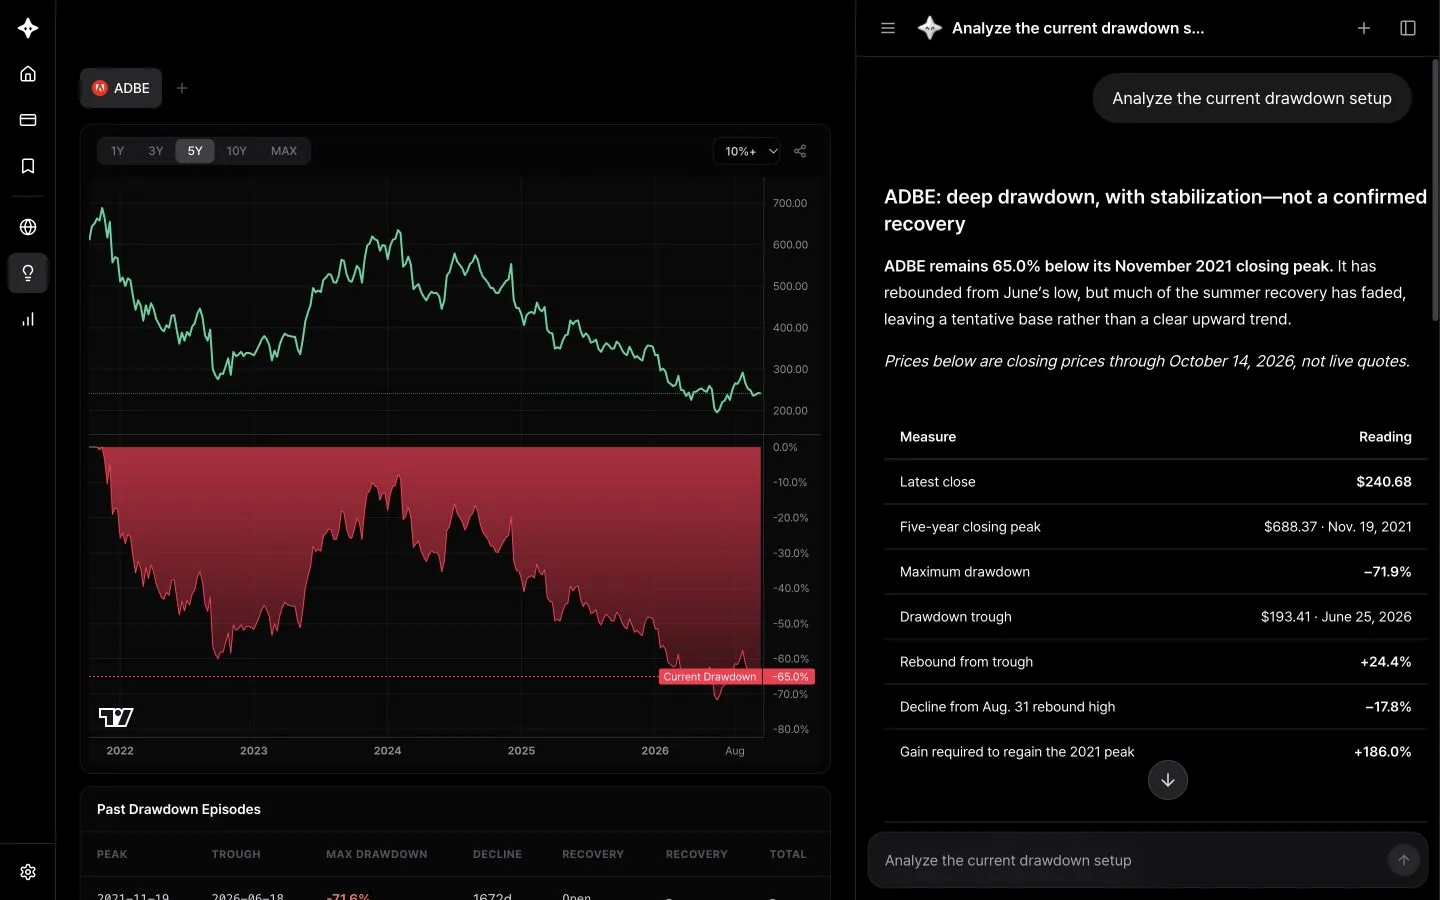
Drawdown Analyzer shows how far a stock is below its all-time high and what declines and recoveries it has gone through. Open AI Research and it interprets the current situation using the drawdown and past declines on your screen.
How to use it
- In Drawdown Analyzer, set the stock, period (1Y, 3Y, 5Y, 10Y or MAX) and drawdown threshold (for example, 10%). Stocks come from your watchlist, so add the stock you want to analyze to your watchlist first.
- Open the panel with the AI Research button at the bottom right.
- Ask your question. The AI receives the current drawdown along with the largest past declines.
Questions to try
- "Analyze the current drawdown setup"
- "How does the current drawdown compare with past ones?"
- "What caused the three biggest drawdowns, and how long did each take to recover?"
- "On average, how long did it take to recover from 20%+ drawdowns?"
- "Are there any drawdowns that haven't recovered yet?"
- "Does this stock tend to have deep drawdowns? Explain its volatility simply"
- "How do its drawdowns compare with the S&P 500 (SPY)?"
Works on other pages too
Even outside the tool page, ask something like "Show Nvidia's 20%+ drawdowns over the past 10 years and how long they took to recover" and the AI calculates the drawdowns itself. You can set the period from 1 year up to the full history, and the threshold from 1% to 30%.
Good to know
Past declines and recovery times describe historical data and don't guarantee future recoveries.