

Use AI Research in News Timeline
Guide
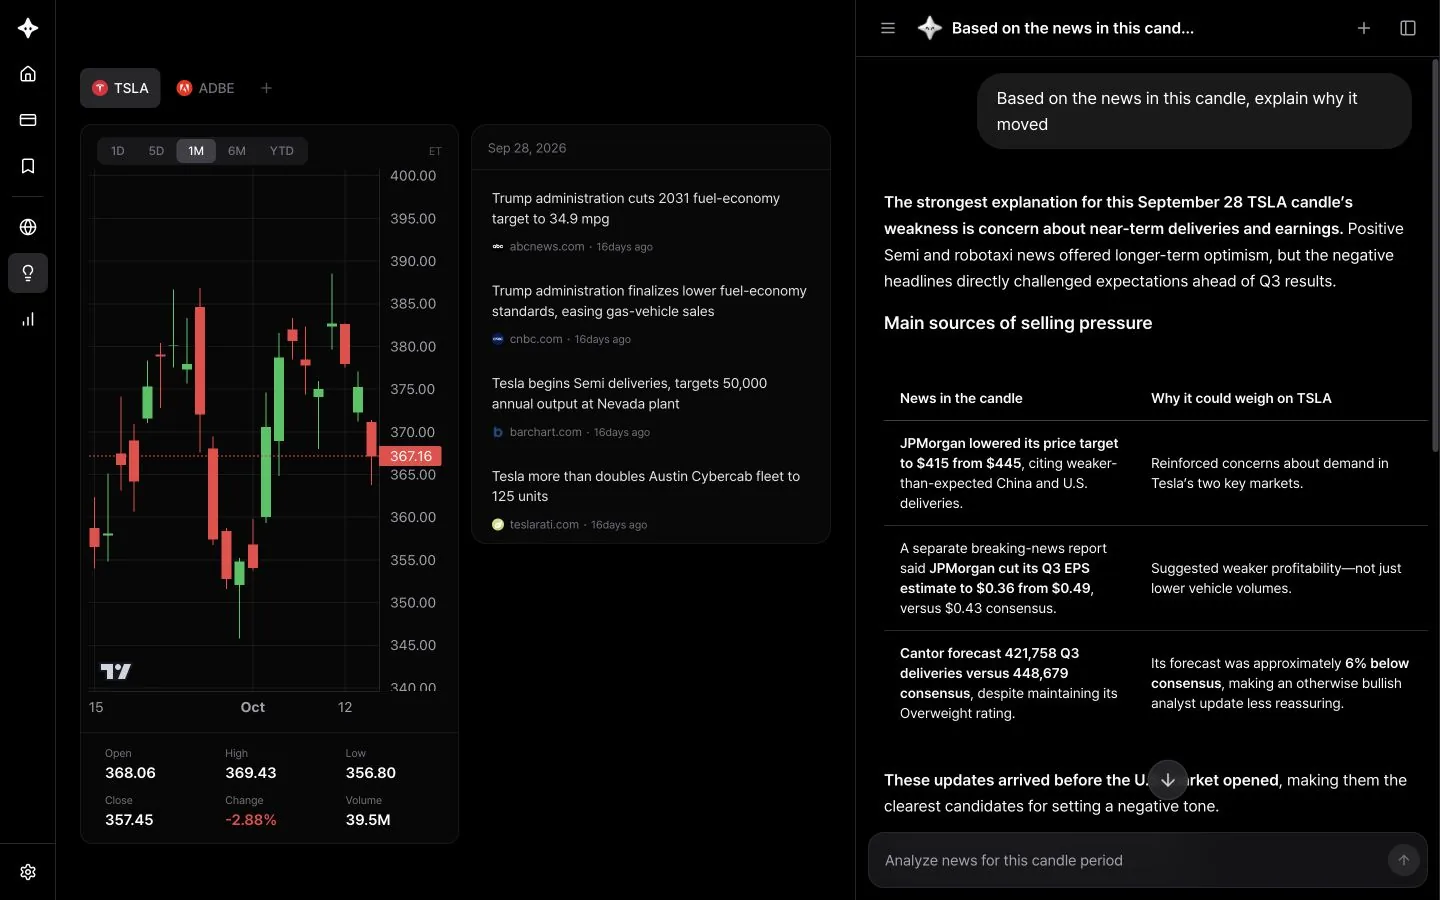
News Timeline shows a candlestick chart alongside the news. Click a candle to open news from that period, then ask AI Research why the price moved based only on news from that candle's period.
How to use it
- In News Timeline, choose a stock and a period (1D, 5D, 1M, 6M or YTD). Stocks come from your watchlist, so add the stock you want to analyze to your watchlist first.
- Click the candle you're curious about. News from that period appears on the right.
- Open the panel with the AI Research button at the bottom right and ask your question.
The AI receives the selected candle's open, high, low, close, volume and time range, then finds news from that period to answer. If you ask without selecting a candle, it asks you to pick one first.
Questions to try
- "Analyze news for this candle period"
- "Why did it jump on this day?"
- "Use the news to explain why volume was so high on this candle"
- "Pick the one story from this period that moved the price most"
- "Split this period's news into positives and negatives"
- "Show only the high-importance news"
- "Was this drop company-specific or market-wide?"
Analyze a single story
Click a story in the news list on the right and choose AI Research to start a new chat analyzing that story.
Tips
- Start with big candles. Long green or red candles, or days with a volume spike, make it easier to find the news behind the move.
- Try different periods. Short periods are good for intraday moves; 6M and YTD help you spot key events within the bigger trend.
- Jump in from another chat. Click the stock card in an AI Research answer to go straight to that stock's News Timeline.
- Each analysis covers up to 14 days of news.