

Use AI Research in Monthly Returns
Guide
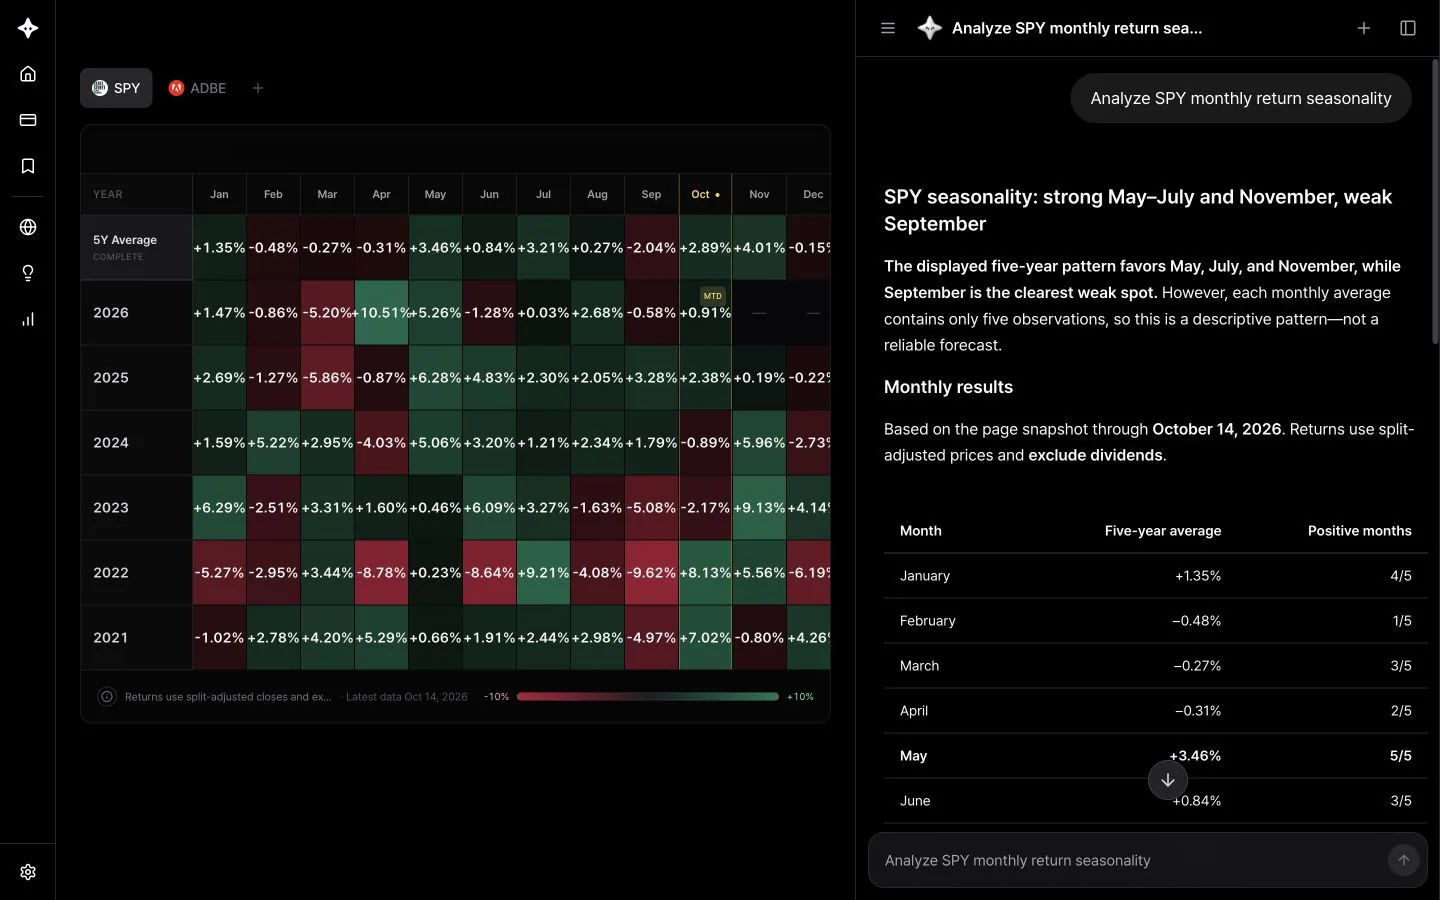
Monthly Returns shows a stock's returns by year and month in a table. Open AI Research and it reads the monthly returns table on your screen and sums up which months tended to be strong or weak.
How to use it
- In Monthly Returns, choose a stock and a period. Stocks come from your watchlist, so add the stock you want to analyze to your watchlist first.
- Open the panel with the AI Research button at the bottom right.
- Ask your question. The AI answers based on the monthly returns table calculated on your screen.
Questions to try
- "Analyze SPY monthly return seasonality"
- "What are the three strongest and three weakest months?"
- "How has next month done historically? How many years was it up?"
- "Are there months with a good average but a wide spread?"
- "Has the pattern changed if I look at only the last 5 years?"
- "Does this stock show a year-end rally pattern?"
- "How should a beginner read this table?"
Tips
- Compare several stocks. Open the monthly patterns for indexes (SPY, QQQ) and individual stocks, then ask how they differ.
- Look at the average and the win rate together. A high average return can come from one or two big years. Ask "What share of years were up?"
- Seasonality is a historical statistic and doesn't mean the same pattern will repeat.