

Use AI Research in Technical Analysis
Guide
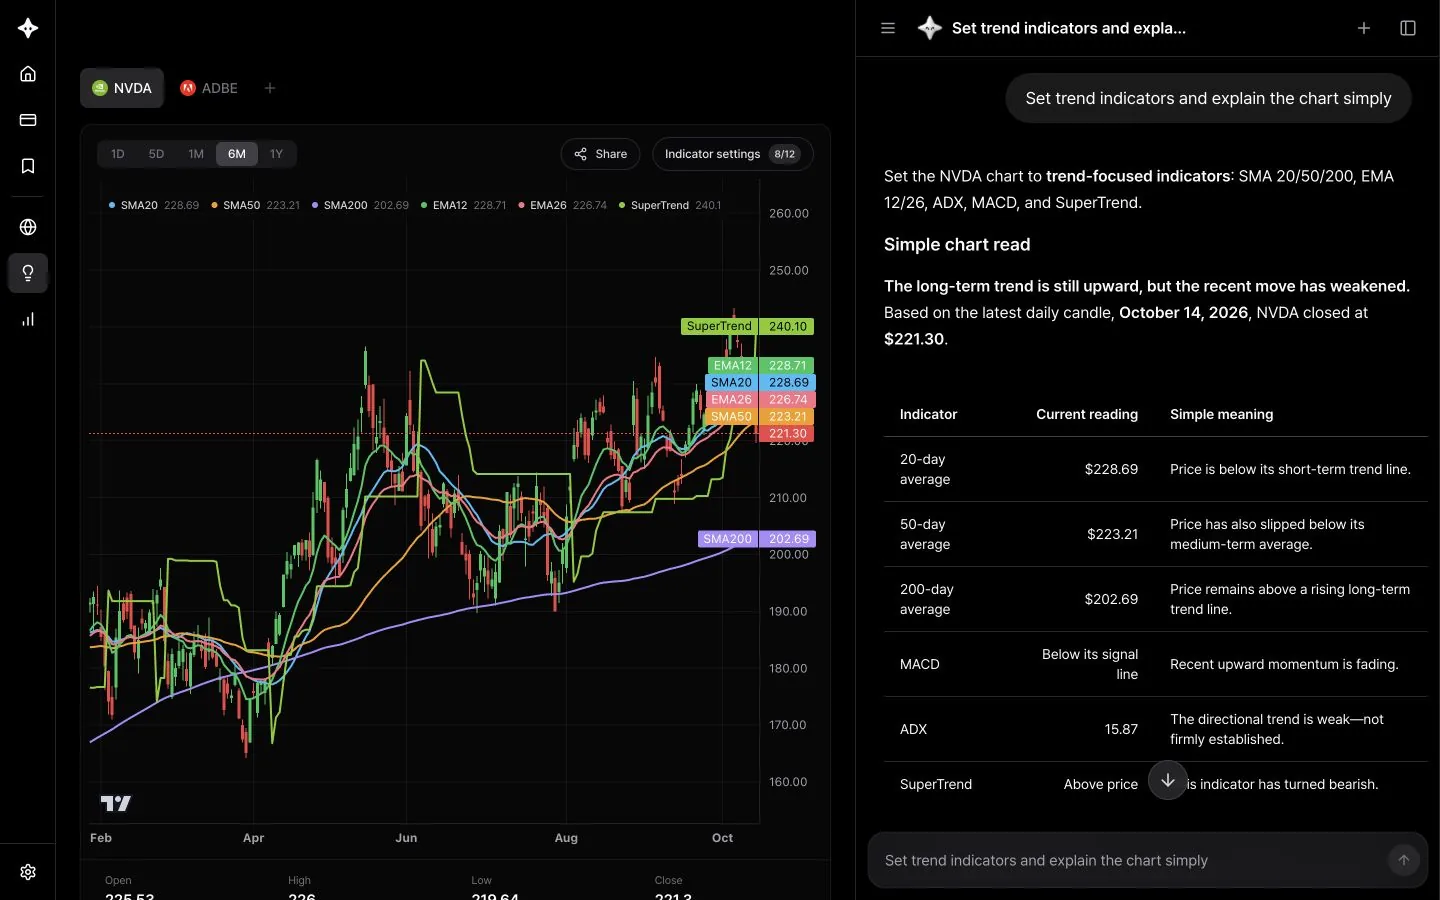
On the Technical Analysis page, AI Research works directly with the chart. Say "turn on trend indicators" and it adds or changes indicators on your chart, then explains the trend using the values you see.
How to use it
- In Technical Analysis, choose a stock and a period (1D, 5D, 1M, 6M or 1Y). Stocks come from your watchlist, so add the stock you want to analyze to your watchlist first.
- Open the panel with the AI Research button at the bottom right.
- Say which indicators or analysis you want. The AI updates the chart's indicators and adds its interpretation.
The AI receives the stock, period, active indicators and latest indicator values on your screen. You can say "this chart" or "these indicators." Up to 12 indicators can be shown at once.
Let the AI set up indicators
| Say this | What the AI does |
|---|---|
| "Set up beginner-friendly indicators" | Builds a balanced set: moving averages (20, 50), Bollinger Bands, RSI, MACD, OBV and ATR |
| "Set trend indicators and explain the chart simply" | Uses moving averages (20, 50, 200), EMA, ADX, MACD and Supertrend |
| "Show only momentum indicators" | Switches to RSI, MACD, Stochastic, CCI, ROC and more |
| "Add volatility indicators" | Adds Bollinger Bands, Keltner Channels, ATR and more |
| "Turn on volume indicators" | Adds OBV, Accumulation/Distribution (A/D), Relative Volume, MFI and more |
| "Switch to Ichimoku Cloud" | Builds Ichimoku Cloud with Keltner Channels, RSI, MACD and ATR |
| "Remove RSI" | Removes just that indicator |
| "Switch to AMD with the same indicators" | Changes the stock and keeps the indicators |
Ask for an interpretation
- "Is it overbought based on RSI and MACD right now?"
- "Where is the price relative to the Bollinger Bands?"
- "Explain the moving average alignment simply"
- "Is the trend still intact while momentum is fading?"
- "Are any indicators giving conflicting signals?"
- "Explain what each indicator means for a beginner"
- "Summarize the big picture on the 1-year chart"
Works on other pages too
Even outside the Technical Analysis page, ask something like "Analyze Nvidia's RSI and MACD" and the AI calculates the indicators and answers. Setting up indicators on the chart itself only works on the Technical Analysis page.
Good to know
- Indicator readings are reference information calculated from past prices and are not buy or sell signals.
- Calculations use the chart interval you're viewing: intraday (15-minute or 1-hour) or daily.